Traders-
Markets are an incredibly dynamic stream of information in which an incredibly diverse range of individuals and systems interact with, dependent on their biases, goals and most importantly their time frames.
Time frames are like the tributaries on a river. Each one has it’s own unique personality but ultimately merges into the longer term trends.
At times, it appears that the market will continue to move with or continue to move against our preferred time frames - but that is simply an illusion as the market forces make it merge with it’s longer term destination- sooner or later.
This was amply at display in the auctions this week. The counter trend rally which I called in this blog at 3500 with an anticipated target of 4150 ended with the markets finally trading that 4150 and a new trend emerged, more in line with the longer term trend we have been seeing for almost one year now. This week’s auction reiterates why it is so important to know your time frames and not to overstay your welcome once the targets in that particular time frame have been achieved.
Whereas the majority was bearish at 3500, the majority flipped bullish at 4150 last week - and the results were for all to see!
In this installment of the weekly plan, I will attempt to answer one common question that is on every one’s mind - has the S&P500 now bottomed at 3500?
Remember the above is simply my opinion, and I may be very wrong but I will try and answer this question with 3 criteria that I use to measure if the bottom is in for this bear market (based on whatever little understanding I have on the subject).
But before that, a quick recap of the plan.
I had two main assumptions in the plan last week-
I thought CPI will come in weaker than expected and the market will rally off 3900.
I thought the folks will get bullish on this at near 4150 and the market will pull the rug then.
Both assumptions were right as we saw a sharp rally from that 3900 area into 4150 in first half off the week and then saw strong selling later in the week.
Here were some of the other assumptions I had that turned out to be correct:
Costco -
I assumed 530 will be a good resistance on this stock and we did sell down into the 460 area last week.
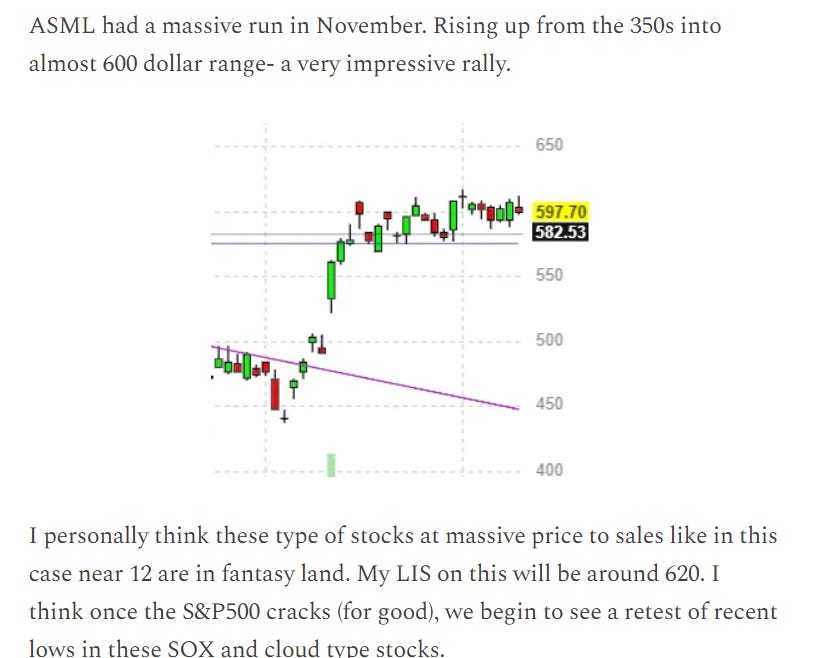
ASML
Bearish on ASML at 620 and saw a good sell off in this week.
ADBE
Bearish on ADBE at 350 and saw a good sell off in ADBE as well .
MRNA
I was a MRNA bear and it did sell off about 7% off my LIS but rallied sharply on the cancer vaccine news and traded as high as 220 bucks before coming down below 200.
Oil
I had a bullish bias on Oil at 70 dollars and the commodity did rally about 800 pips from this level last week.
If you want to receive my views and personal thoughts like this in your inbox every day, do not forget to subscribe and share with your folks.
So has this market bottomed?
When we last traded 3500 and change on the S&P500, I noted that for what remains of this year, I do not see much downside- unless we were to retest 4100-4150 again.
I was correct in this assumption and we traded up to 4150 last week and then crashed more than 350 points on the Emini S&P500 off that level to close near 3820. Naturally, evert one is now curious (including me), if the 3500 low will be tested and if so, will that be holding or folding?
There are 3 main criteria I will use to historically valuate if a market has seen a good low.
Why I use this? Because I think a good low is almost always carved out by the smart money jumping in and as a result creating low inventory at these lows. While no one can for sure say if this is indeed the smart money in the market there may be some clues to be gleaned.
Excessive volume: Ultra high, excessive volume can signify a climactic low. This is the capitulation plus the “smart money on the sidelines” jumping in. This could be 200-300% or even more of the normal volume.
Excessive volatility: same logic as before but this time we witness movements which are several standard deviations above the normal and could lead to what is known as a “limit down “ move. Frankly, I have not seen a low my self without at least one accompanying limit down move. This goes back to 2008 era.
No where to hide: I called this back in January that when you see Energy and finance sector outpace the tech sector , this often marks the end of bull markets and lead to a new bear market. This was in fact the case. When liquidity starts drying up, often times , the tech stocks will be sacrificed the first. Often energy and finance stocks pay dividends and when liquidity dries up, the energy stocks can pay dividends and can rally even in a general bear market. This is what we saw in this year’s bear market. However, at the end, demand will fall off the cliff even for energy companies and we will see those stocks also underperform. This comes once we are in recession. That could be another clue that we are now close to a meaningful low.
Now, you tell me , how many of these signs have you seen this year?
I have personally not seen a single one. Yet.
An outright sell off to the lows , especially now a days with computer based trading, hundreds of quant strategies and noise, is not the way it usually goes. This goes to my earlier example from the river and it’s tributaries. The market is grinding down on longer time frames but it is not falling down. It is just that the whole process can take about 2 years so we do not see it in slow motion.
On an admin side note, due to good reception of the new chat feature in this Substack and higher costs, I will be executing a price increase on January 1st and the new price will be 39 dollars. This will only impact new subs and old ones will be grandfathered in. The price hikes will not impact the Founder plan, only the annual and the monthly ones. You could subscribe now and not have to worry about future price increase- FYI.
My levels for next week
Let us look at some related markets to glean some clues what the S&P500 may be up to next few days.
First off AAPL
I have remained a tremendous bear on AAPL where I refused to believe any positive spin on this stock by a myriad of AAPL analysts - many of these guys are actually on payrolls where it makes it an incentive for them to push these stocks on folks .


