Folks-
Welcome to another iteration of my personal journal and blog where I prepare for the week ahead and I am happy to share my personal thoughts and opinions with any one else who may be interested.
A little abridged plan today as I have a family reunion but I did want to send some thoughts out to the folks.
Let me start with a quick recap of my plan and my ideas from last week. The link to the plan can be found here.
First off, I was quite spot on with the short term levels and biases, however, my swing time frame bias did not work so far and it may be that I am a bit early. Whether I am wrong, I think we will find out in a week or two.
On the S&P500 emini side, I was bullish for most of the week except on Friday.
I had shared and communicated my thoughts on a key range around 3650-3730 with every one and I reiterated why I remained a bull near the range low and a bear near the range high, prior to the PCE news on Friday.
On Friday however, the PCE came in stronger than expected and it is here that I anticipated the range will break and I sent my thoughts on this how I expected that this rally after the PCE may be “trappy” and will not last. This was indeed the case as we sold down heavily from near 3600, all the way back down into near 3580.
Now I have been wanting to see a retest of that 3950, I have been a bit off on my swing time frame call of a test of 3950. For what it is worth, I have reiterated several times we will need to see a couple of closes here above 3720 for that call to materialize. Again, no way to sugar coat it but I have been a bit off on timing of this call. In overall scheme of things though, we have not moved away much from the 3650 range low at the time of this post. I have been a S&P500 bear from several months now, I first became bearish at 4800, before we sold down to 4200, and it is here that I was bullish again on a swing time frame perspective, expected a test of 4700 which was indeed the case.
Now we are near the lows again. In fact we have made new lows this week. This fact along with the following ones is what caused more volatility in the emini market this week in my opinion:
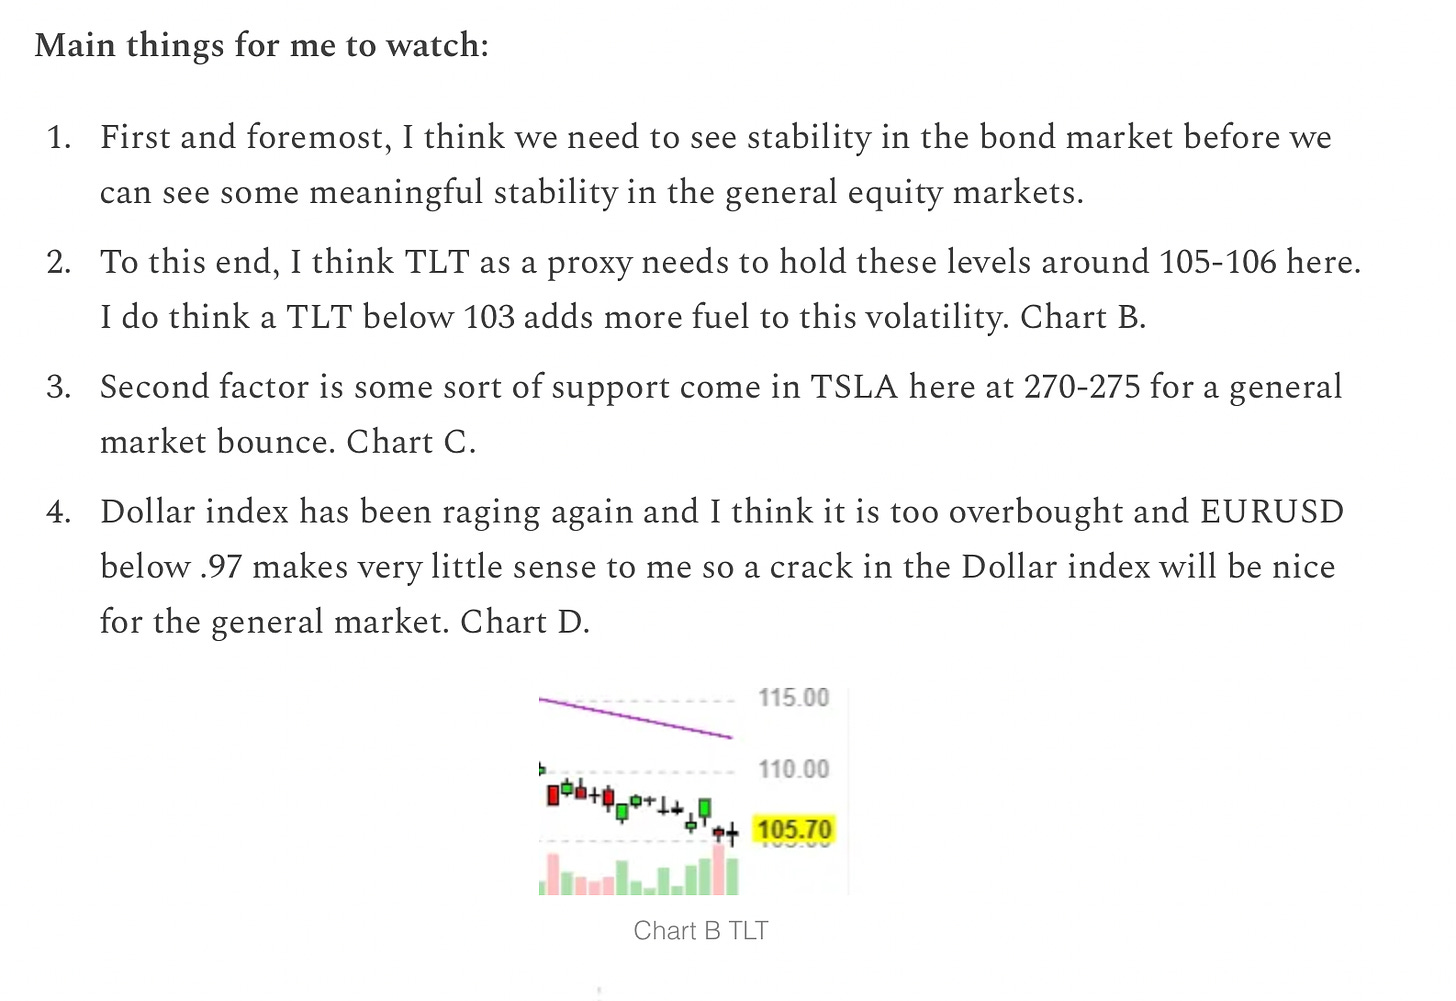
That break of TLT below 105 area.
The break in AAPL below 150.
The break in TSLA below 270.
These 3 are huge factors and I have been reiterating how important these levels will be from many weeks now.
Image A below. TLT 105 level was sacrosanct for me and once we traded below it, it pulled rest of the market with it. I do not focus on any one of my statements if the corresponding, related markets are not going to cooperate then it is perhaps unlikely that the idea will work out. This is why all IF statements and all related markets are key.
How did some of my other ideas fared this week?
Let us start with the earnings front.
I was a big bear on CarMax KMX on it’s earnings. This stock crashed 25% a few sessions after it’s earnings.
I was a bull into Micron earnings but the stock had only a brief rally off 47 to 50 where as I had expected a retest of 55+ and the stock remained almost unchanged.
I was a bull on both SAVA and ASAN stocks both of which had a decent week in the beginning and sold off a bit in latter part of the week due to general market volatility.
I was an oil bull off the lows around 76-77 and we had an impressive rally in oil going back to retest above 82 on the WTI.
I was also a healthcare stock bull and in particular on UNH. UNH remained unchanged for most part whereas some of the other healthcare names had a good run on the week.
The bottomline is with these plans, I need to know my time frames. I can divide my ideas into 3 time frames:
Intraday Trader Tic: these are simply the levels and context for the same day and nothing longer than that. The risk tends to be extremely tight on this, often only as much as 10-15% of the days range.
Investor Tic: these ideas can be multi month to multi year and can allow me more breathing room for the market to go against me, however, for most part, I will not take more than 25-30% heat on any of these ideas.
For any of my ideas on the swing time frames which can be days to weeks out, I am looking for references like the recent balance area low and balance area high in the market, it is also most impacted by the correlated markets. So if I am bullish on S&P500 and my main context is that the bonds will find a bid and the bonds start selling off instead, then my primary thesis has been proven wrong to start with. No point for me to linger around.
Use the link below for a special offer.
Event risk for next week
There is not a much event risk next week up until Friday when we have the Non-farm payroll (NFP) numbers out. There are some ISM inflation numbers and some global central banker meets before that but Friday takes the crown as far as key events are concerned.
The biggest risk event actually comes on October the 13th in form of the September CPI report.
Over the weekend, there has also been some chatter on how some of the Eurasian banks, especially the CS, may collapse. I do not doubt that these banks have a lot of EM exposure, on top of that they have liquidity issues in Europe as well. I do think we will see some key institutional failures, soon if not this week.
This is inline with my expectations that we have started the process of capitulation and last week could have been the very first wave. These events pan out over 3-4 waves and we have just started this process IMO.
The MOST important chart to watch?
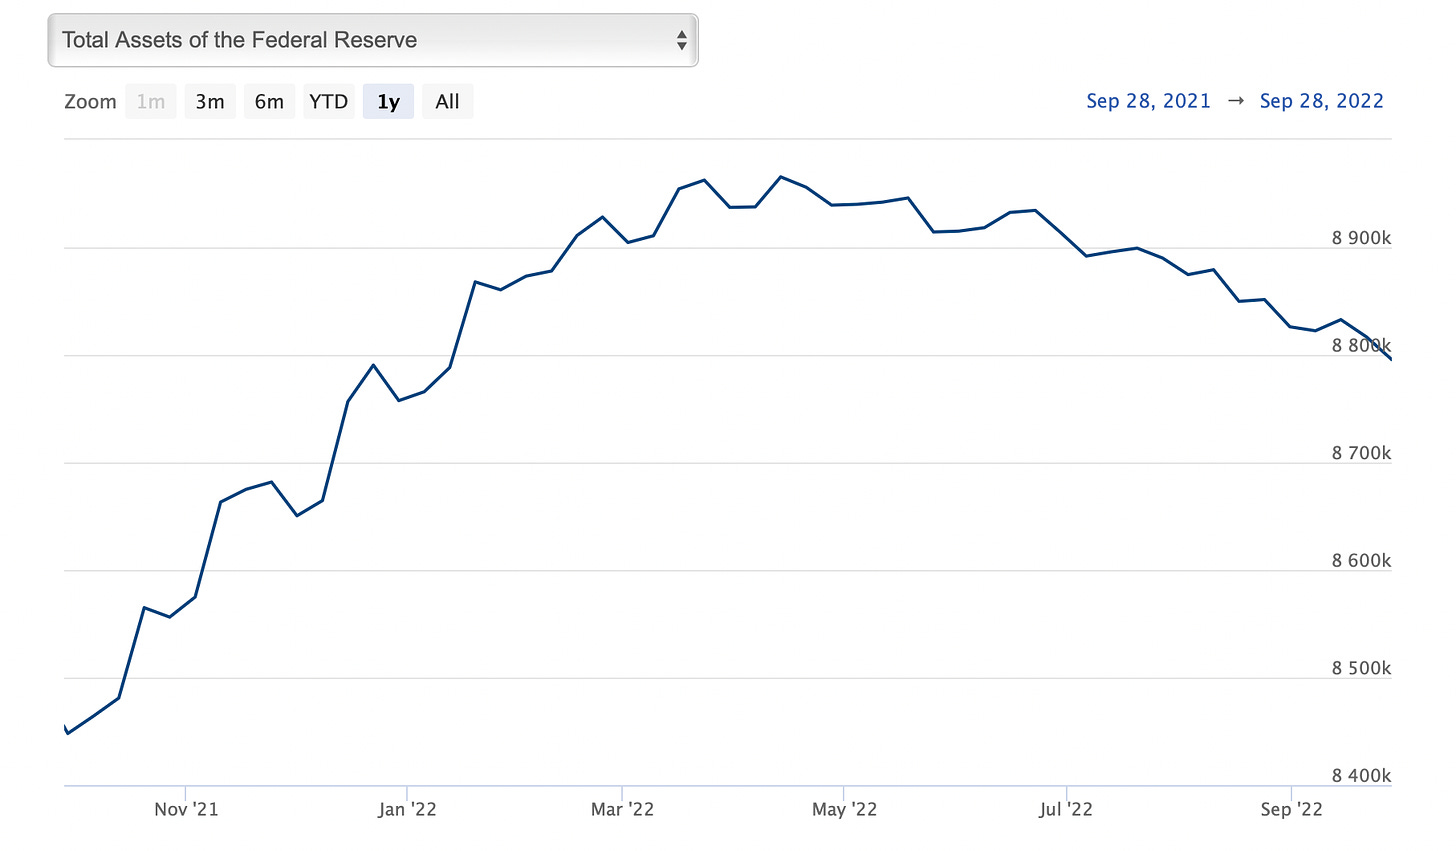
I will share a few things that I am going to be on lookout for this week as well, however let me first share the recent trends in the FED balance sheet which has been going down steadily this year and has now come down to about 8.8 trillion dollars.
This trend or the downtrend has for most part coincided with a down trend in the price of the stocks.
Image B above shows the FED balance sheet trends in recent months.
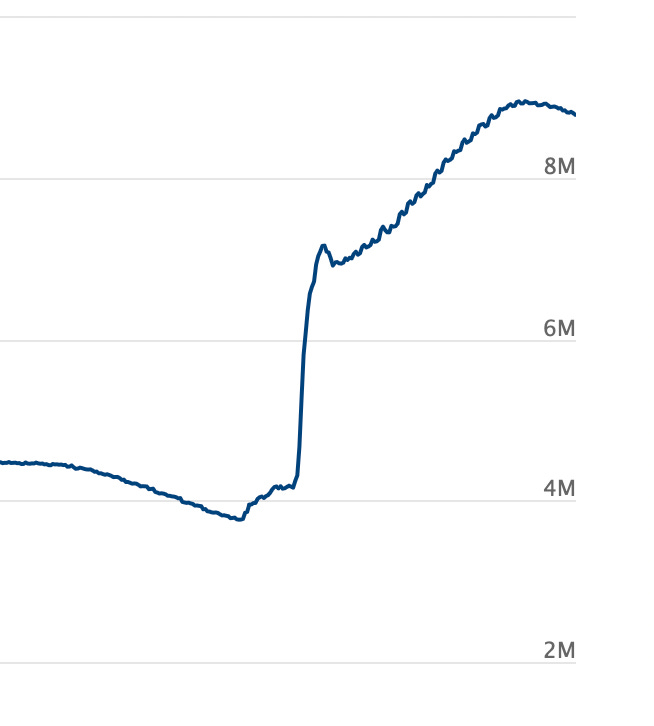
When you zoom out on this chart, image C below, you can see the extent of the bubble in stuff that the US FED owns. While the stocks have fallen a lot, many falling 80-90 PERCENT off their peaks, you can see the FED assets have barely budged in overall scheme of things.
This is rather laughable that a mere 95 Billion reduction a month of the balance sheet of world’s most influential central bank has taken the starch out of the global stock markets.
Just imagine the horror if we were to cut it down just to the pre-pandemic levels at roughly 4 trillion dollars!
If the FED followed through on their promise to rein in the balance sheet and were actually honest about reducing it down to pre pandemic levels, we are looking at a potential armageddon in asset prices.
Will we ever get there?
Now obviously there is a natural floor to the relationship between the spooz and the FED balance sheet. I think that is certainly not at 8 trillion, is it at 6? Is it at 5? Any one’s guess, but I would think as more and more of this balance sheet shrinks, it will take the fluff out from the bubbles every where- until we reach some point where all or most of the fluff is out, it stops mattering how much the balance sheet shrinks as fluff becomes value, and we can begin to see an end of this vicious bear market.
This chart alone puts into a visual perspective what I have been saying for over many months now - the US equity valuations were insane and I think they still are insane and if the FED continues to shrink their balance sheet, even if the rates were to stay unchanged from here on, there is a lot of fluff that still needs to come out of all sort of asset bubbles.
When you look at this chart, and you see where it needs to go eventually, where will you put a low in the stocks?
The reason I show these charts is to demonstrate the extent of this monster bubble that the successive governments and successive FED governors have created. I ask my self will this bubble ever burst? And if so, is it about to burst this year?
While I will confess I do not know the answer to the former question, I do think I have a fairly good idea that this bubble does not fully deflate this year. Or what remains of it.
This is a very complicated year and unique in many ways.
First off, we have not seen such a sell off in bonds and stocks at the same time, dating as much back to 1970s. So we are witnessing a once in a generation event here the way we are seeing wealth destruction across asset classes.
Then, we , the US are in a proxy war with Russia and wars as it is are inherently inflationary .
This is also an election year in the US with voters headed to polls in less than 6 weeks.
As if this was not enough, the world is emerging out of a global pandemic. The world is finally reopening with borders being thrown open again.
Old habits die hard. The bubble collapse process can be very elaborate and could be very long winded. A bubble that took 50 years to build will not collapse fully in 6 months.
I also think the powers that be, specifically the FED and the US government are still very pain averse. While they claim to want to end inflation, I do not think there is much willpower and I think soon the political realism will set in and the US will embark on even more easing, unleashing another wave of inflation. More on this later.
Amidst all this , you have the sell off in bonds, which in many cases have sold off way more than any speculative stocks and even have sold off more than S&P500 on the year.
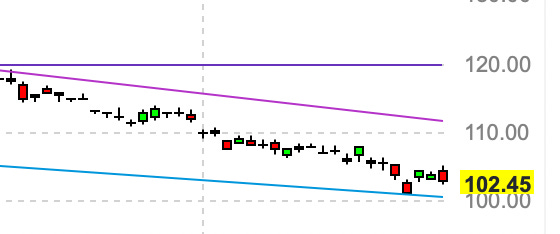
I use TLT as sort of a proxy for bonds but this gets the job done and you can see the extent of the sell off, from it’s peak in 2020.
I have never seen anything close to the action when US bonds are trading like meme stocks up or down 4-5% on the day at times - this is the largest market with respect to the daily turnover.
The way I visualize TLT or the US bonds is that I think they are close to a meaningful bottom and when I say meaningful I mean it could tend to last 2-3 months or even more.
The way I see action in TLT is two ways:
TLT I think should find some comfort and support here around 99-100 NOT because all the issues in world are solved today and the inflation is now back down below 5%, but solely because a TLT below 99-100 becomes a symbol of worldwide systemic failure.
This is why I think the FED will panic and blink and this may put a floor in TLT (and the US bonds).
If this is not going to play out like this, and if we are continue to sell off in the bonds, I think we are in for a very volatile few months in the equity markets as well.
So while the FED may not be interested in supporting the stocks, they may very well be very vested in saving the bonds - at end of the day, the US government is still in full on populist spending mode and they have no money to spend. So what do they do?
They take on more debt. Not only the higher yields cost a lot to debtors like the US government, there is also a question of can they even sell this debt when the bond buyers expect their principal to be down 10-20% next year?
So, yes I think the bonds will need to be supported here at some point and when this happens, the associated risk on assets may benefit as well.


