Folks-
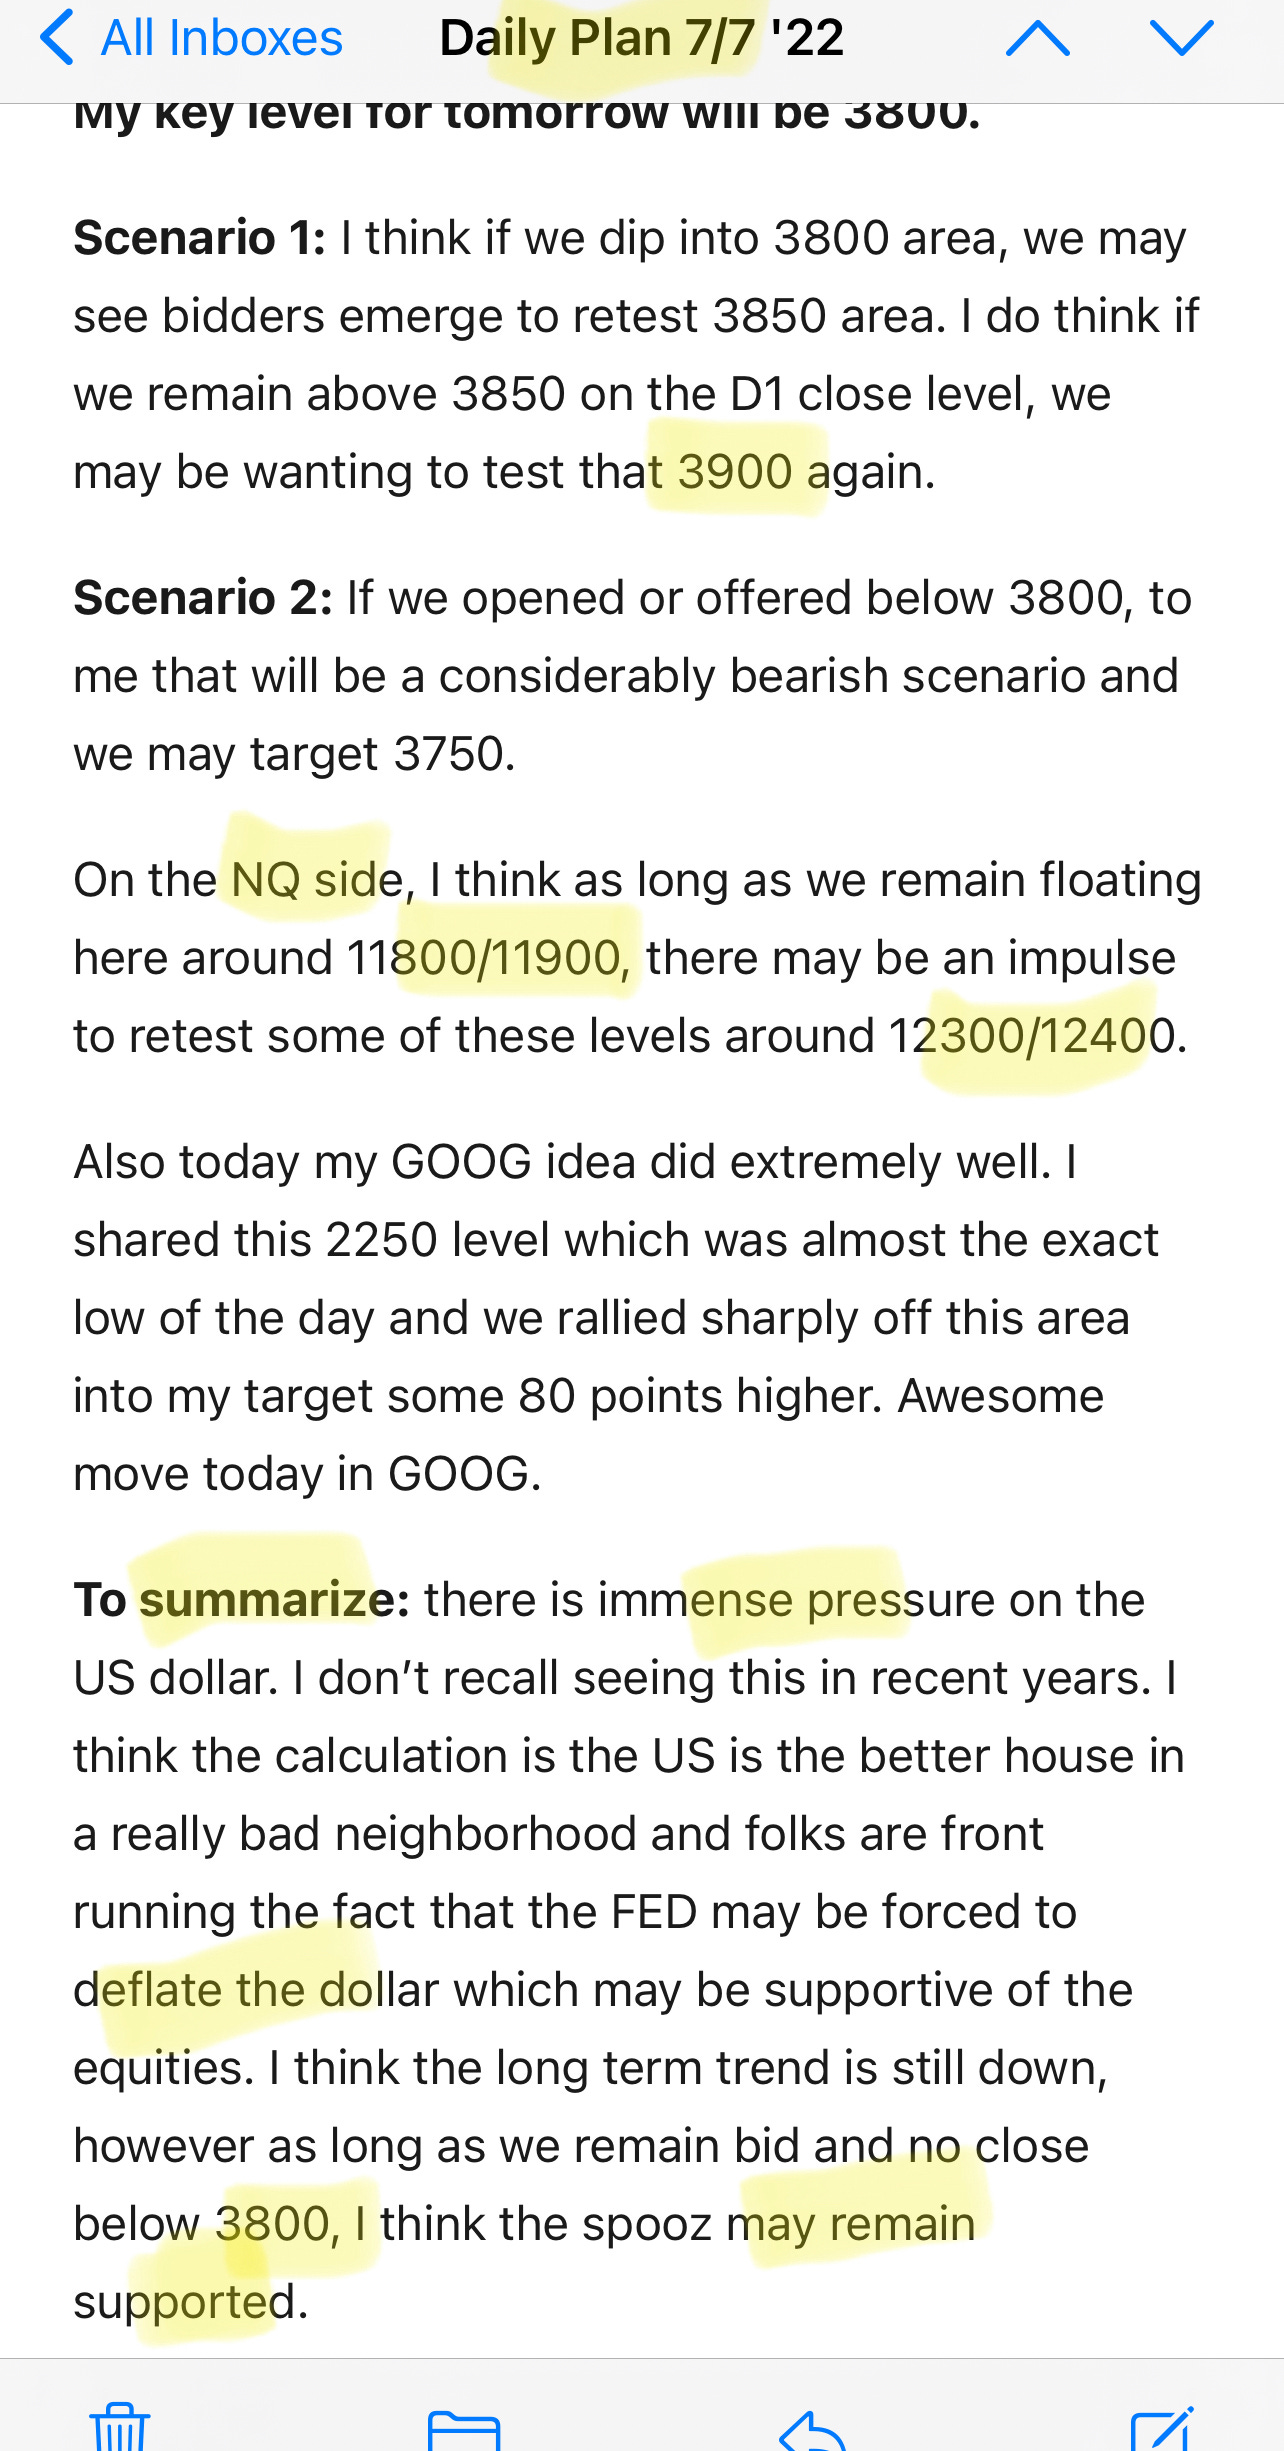
Last night, for 2nd day in row, I was bullish and did not expect bearish activity as long as we remained bid above 3800. On top of that, just like yesterday, I shared an intraday update warning that we had a strong support at 3860 which I did not want to go against.
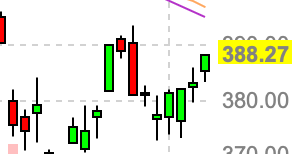
See below for intraday update. LIS is the Line of Sand. It is the level where if I am bullish and if we trade below it, I will know I will have been wrong in my bias. FYI in case some one wanted to know what I mean by LIS.
My target at 3900 was just hit at time of this post. And we are trading here near the highs at time of this post.
Here is a link to the plan from last night if you have not read it yet.
Not only did my ideas in ES, SPY did well but also my calls in GOOG turned out to be amazing. It is now trading 125 dollars above my level I shared on Tuesday.
If this was not enough, both RBLX and ETSY names are up more than 5% today! Shared all with the folks here in the Stack.
Before proceeding, I do want to address why I include up to 2 scenarios in this daily newsletter.
This question seems to have perplexed many new traders and I think I should spend some more time explaining this.
This is a 2 part answer.
First part is as part of my preparation for next day, I want to be ready for both bearish and bullish days. I am not going to tell you I know with 100% certainty what is gonna come tomorrow. But my levels give me a good sense if the market is being supported or distributed.
Then the Daily newsletter is tactical and the levels are geared for shorter term swing or intraday moves. As an active trader, I often have 2-3 scenarios. Pursuant to the letter last night, intraday, I do not predict. I react. And for me to be able to react, I need to do my preparation ahead of the day. I am not going to prepare my levels when the session in active. This is where the two scenarios come in. I want to know what will be my bias if we opened below 3800. I need to know what will be my primary bias if we opened above 3850.
My weekly newsletter is the one that is geared more to longer term trends and themes and levels. Here is a recent example (click link).
While I include 2 scenarios every day, sometimes even more, it does not mean I am not clear of the primary trend. In fact on most days I have a strong bias one way or the other. For example, here is the 2 scenarios from last night. However, if you read closely my bullish bias is evident. See below as an example.
My bias is crystal clear in most of the newsletters that I author. It is just due to the large size of my account, I am not going to go out and press some one’s buy and sell buttons for them. This is not going to happen. Now there are some days when I may not have any bias - if the market gives me not clues, I don’t know if we are going up or down, and there are 2/3 days out of every 10 that I have no idea what the market may do intraday time frame - on those days, I rely on my levels to make sense of it. Hope this made sense.
In other news..
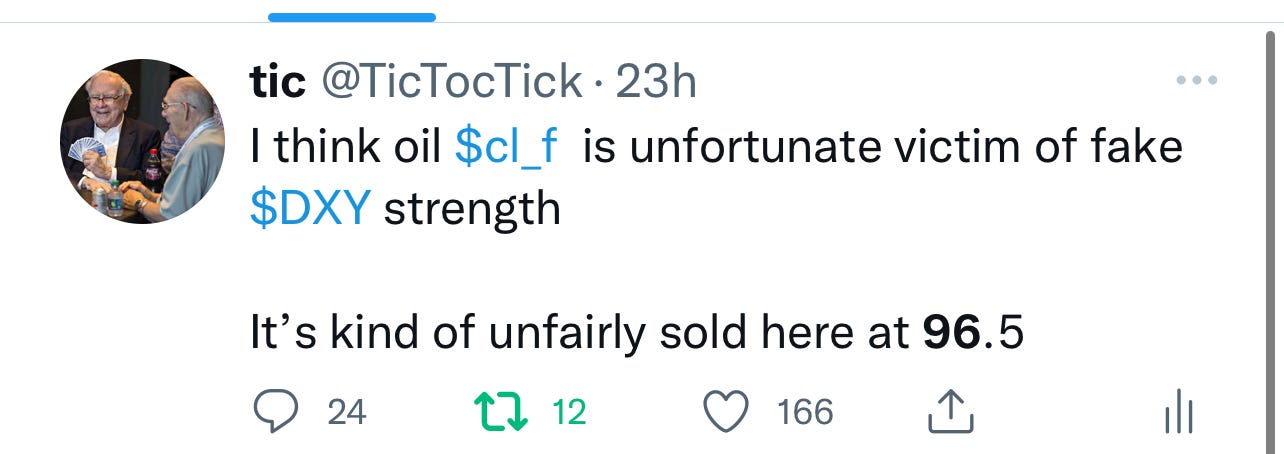
I was bullish on Crude and thought it ought to hold that 96/97 area. Well, lo and behold today we staged an impressive rally of almost 1000 ticks off my levels. It has now closed near 105.
See this kind of action gives credence to my view that a 100 dollar oil is here to stay for a long time. Unless we were in severe recession. My weekly newsletter covers this in great detail. See below.
This is a FREE preview of my daily newsletter that I write to 25000 subscribers like your self. If you want to receive up to 5 similar newsletters delivered in your inbox then subscriber below. The basic membership is 100% FREE and you can start receiving these instantly. Subscribe now before reading my S&P500 levels for tomorrow.
My S&P500 levels for tomorrow
Chart A below. SPY approaches resistance. This downward trend line on SPY has been it’s Achilles heel and I think it may remain troublesome for it once it starts exploring these levels as mentioned below in last section.
My key level for tomorrow will be 3830. We are trading about 3903 right now.
I think we are close to meaningful resistance now but I will be wary of being a short term bear above 3830 as I would like to see a close below it.
Scenario 1: I think as long as there is no D1 close below 3830, dips here may be bought. Targets may be weekly resistance at 3967. Personally, I feel once/if we get closer to these highs today, there may be some folks who were bearish earlier and throw in the towel to chase this rally and we may end up falling to 3830 before ripping again.
Scenario 2: I think sellers may emerge if 3967 gets tested for a retest of 3900, followed by 3830.
Scenario 3: Tertiary scenario is we open below 3830 which IMO will be on account of some really bad macro event and could target 3750.
At time of this post we last traded 3900. Remember all levels and scenarios are my private opinions and all of them may be very wrong.
Longer term, I think we are in the process of topping over but that will be confirmed for me once a D1 close below 3830.
I may revise my bias at 3967, if it gets tested dependent on what order flow I see there.
Be nimble, stay safe. And share this FREE post with everyone in your circle so we can get to more order flow traders.
~ Tic
Disclaimer: This newsletter is not trading or investment advice, but for general informational purposes only. This newsletter represents my personal opinions which I am sharing publicly as my personal blog. Futures, stocks, bonds trading of any kind involves a lot of risk. No guarantee of any profit whatsoever is made. In fact, you may lose everything you have. So be very careful. I guarantee no profit whatsoever, You assume the entire cost and risk of any trading or investing activities you choose to undertake. You are solely responsible for making your own investment decisions. Owners/authors of this newsletter, its representatives, its principals, its moderators and its members, are NOT registered as securities broker-dealers or investment advisors either with the U.S. Securities and Exchange Commission, CFTC or with any other securities/regulatory authority. Consult with a registered investment advisor, broker-dealer, and/or financial advisor. Reading and using this newsletter or any of my publications, you are agreeing to these terms. Any screenshots used here are the courtesy of Ninja Trader, Think or Swim and/or Jigsaw. I am just an end user with no affiliations with them.


What do you mean by these highs? "Personally, I feel once/if we get closer to these highs today, there may be some folks who were bearish earlier and throw in the towel." High of 3900 or 3967? Thanks.
Love to hear your thoughts on mrna and tsla moves today