Folks-
This last week marked another good week for OrderFlow with me turning short term bullish on Tuesday night at 3890, just in time for this almost 200 point rally off those lows.
This was followed by my OrderFlow pivot of 3950 on Thursday as well as that 4010 IB Close on Friday. This saved me from stepping in front of this counter trend momentum where a lot of other folks who decided to become bear below 3900 were steam-rolled.
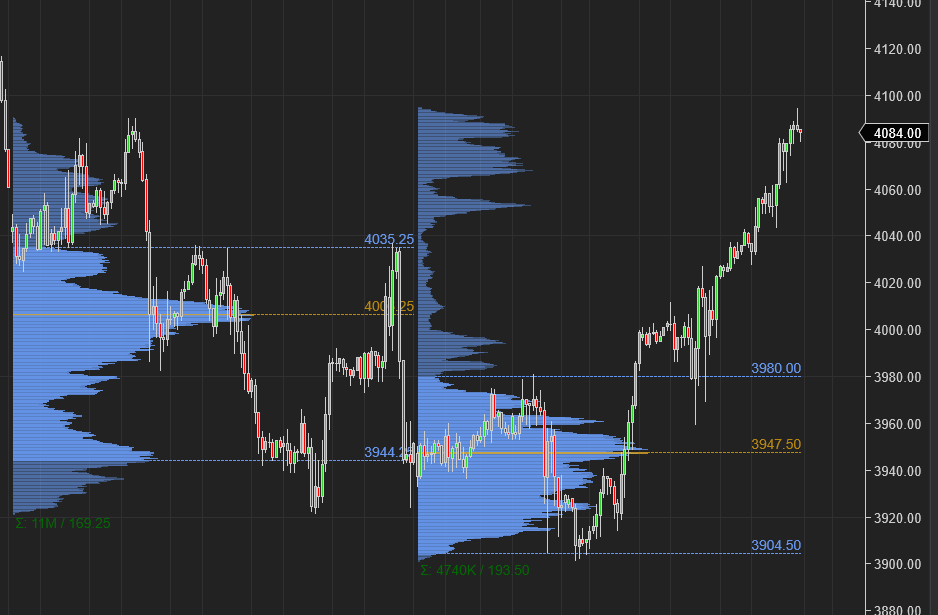
Chart A above with the 3 day rally in Emini S&P500. Price has moved up about 200 handles however the value has remained lower.
Here is a link to my prior weekly plan.
The events of last week underscore how the markets can not move in a straight line and why you need good levels and context to avoid getting hit by the bus. I had also touched upon in the last weekly plan that I do not like when all the so called “experts” converge on an agreement- that never ends well and this week was no exception.
The experts are often times all looking at the same information or data at the same time and this breeds conformity- they may be missing out on finer nuances and specific knowledge- I personally stay away from the experts as much as possible especially in the markets.
Currently a few forces are acting on the market:
Widespread belief that the inflation has peaked.
Widespread acceptance of a 75 BPS hike on the next FOMC the week after.
US is the best house in a bad neighborhood so money is flowing into the US equity markets- especially in momentum stocks like TSLA.
I do not disagree with any of these - I think they are all correct assumptions. However where I disagree with the majority of folks is how much of this is already priced in versus new catalyst for the price.
What is the new catalyst for new price action anyways?
So when you look at 3-4 months left in the year and the S&P500 here hovering at 4100, pretty much unchanged from last 3 months, you have to wonder what could be the catalyst here for further move in any direction, up or down?
For me personally the below are key unknowns:
The outcome of the US housing market- we are sort of in a spot where the buyers while have noticed demand destruction, are not willing to offer too many discounts and the sellers are not willing to pay up. I personally think, the 30 year rates at 6%+ is historic due to the sheer price appreciation of the homes in last 2 years. I think in some metro areas, the sell in housing will be dramatic and we are not there yet.
The extent of recession- The US is just in a “technical” recession. I do not believe the US is in a real recession which I would characterize by a widespread loss of jobs and a dramatic fall in home prices. The part that is not fully clear to me is which way is the Camel gonna land with respect to the US companies’ ability to finance their debt and keep up with the interest payments when the interest rates are closer to the 4% this year end. I think even if the FED tightening has peaked and assume the FED begins QE later next year, the effects of this current rates will take a long time to cycle thru the system and will cause many companies to go bust. This will lead to unemployment and a crash in housing.
The European winter- Europe is very weird when compared to the US. While the rates are much lower in Europe right now compared to the US, the financial conditions are much more tight. I think Europe is in a recession and I think this will become much worse as we progress into Fall and Winter. The European leaders have done a good job of making sure they have enough gas stored for the winters, I give them full marks for that. Europe is also one of the largest trading partners of the US companies and this will eat away at S&P500 profits.
Look, the current market is front running, anticipating a lower than expected CPI on Tuesday. This may well be the case, but at some point it will stop mattering what the CPI is and the real issues described by me in points 1 thru 3 above will take centerstage.
The financial conditions in the US despite 8.5% CPI and despite the hawkish FED are extremely loose. This is why S&P500 rose 200 points this week in face of a dozen FED speakers trying to talk it down.
In this weekly installment of the trade plan, I share the following insights:
My levels in Emini S&P500 ahead of the CPI
My thoughts on ADBE earnings
My updates on Oil, Gold and TSLA amongst some other updates
For those new to the newsletter, I recommend you read the following educational post to get familiarized with the basics:
These plans are result of watching Level 2 six (6) hours every day and carry a lot of thought process and planning. If you like my work, consider sharing with traders like your self.
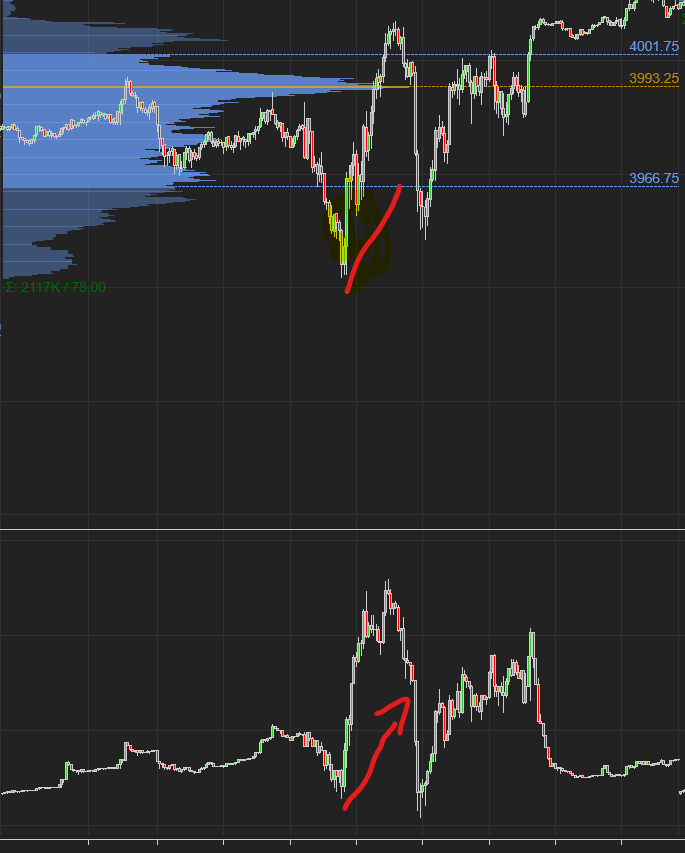
Some folks asked me about my intraday bullish call at 3952 on Thursday before that rally into 4010 and wanted to know what was my reason for this call.
Chart B below.
The first pane has the volume profile and the 2nd pane has the Cumulative Delta. Cumulative delta is simply the graphical visualization of trades on offer minus trades made on the bid. A positive delta signifies that the buyers are hitting the offers harder than the sellers are hitting the bids.
As soon as we opened on that day we sold down to 3940 and missed my target at 3934 which was prior day’s Value Area Low (VAL) by a few points.
This was accompanied by a surge in Cumulative Delta and a close above the day’s Value Area low, back into the value. This was my signal that unless this 3952 is taken back by the bears on weak delta, we may see support come in at 3952 for rest of the day, and this was indeed the case as this level was key all through the day and we saw two (2) 50 point + rallies off this level.
Hope this answered some of the questions around this level!
Feel free to subscribe now to get up to 5 such insights every week on what I see on the tape.
My Key Levels for this week
Look at Chart A above.
The value area has not budged while the market has moved higher.
My key level this week will be 4100. The market closed near 4080 on Friday. The levels quoted from here on will be based on the December contract.
Note that Tuesday is the CPI day and it may get extremely-volatile and choppy. If this was not enough, we also have a big MOPEX next week on the 16th. So should be a pretty volatile but fun week.
OrderFlow is agnostic of direction and will go wherever the line of least resistance goes in the short term and I look forward to share all such updates as I see them with the folks here.
In general, I think the bears need to prevent a Daily close above 4100 this week to put an end to this rally. From a tactical perspective, you have CPI on Tuesday morning one hour before the cash open. Everyone and their dog will be watching this and will be trading this based on whatever their understanding of the final number is.
If I am a small stop loss trader, I think it is safe to say the conditions on Tuesday may be quite volatile with a large range day possible.
Scenario 1: As long as there are no Daily closes above 4100, I think we may revisit 3980 area from last week. A close below 3980 could bring more selling to target 3892 later.
Scenario 2: A close below 3980 may mean 4030 becomes resistance if revisited during the week for a trip back down to 3980.
Scenario 3: I may not pay much attention to a Daily close above 4100 on Monday. In general, for intraday trading, an IB close above 4100 could even be bullish for the session targeting 4130. However, I will be curious to see if we get a close above 4100 on Tuesday at 3 PM. A Daily close above 4100 on Tuesday may mean we go back up to see what is out there at 4170-4200 yet again. But again, that is 2-3 days out and I would like to see the Tuesday orderflow to have more confidence in a call like that!
I will address this via a Daily Update on Tuesday, if this indeed turns out to be the case.
To summarize, I think 4100 is a key level in the intermediate term and bears need to defend it. On the downside, a Daily close below 3970/3980 opens door to more volatility.
To translate this into CPI scenarios:
I think if we get expected CPI, we may see the week’s range in 3980-4100.
If the CPI outright crashes, I think it is safe to say we will get that D1 close way higher than that 4100.
The wild card may be a hotter than expected CPI and I think in that case, we see much more volatility on the downside, closing the week at 3900 or lower.
I feel the market focus will soon shift from the current CPI on month to month basis to the results of FED’s failed policies.
The FED printed a lot of money last year , incorrectly calculating there won’t be any inflation and that did not stop the sell off we are now seeing.
The same way the FED is making mistakes right now which will be clear in the hindsight a year or so from now. Yes, they will pivot at some point crushed by the political pressure, but the US system can not handle 4% + interest rates for extended period and it will crumble under the weight of the debt and debt payments. Therefore IMO it will not matter very soon what the CPI is and it will become all about undoing what the FED had been doing for over a year- and the outcome of that process remains unknown IMO.
Technically, you can see in SPY Chart C below that 4100 area is recent support turned resistance.
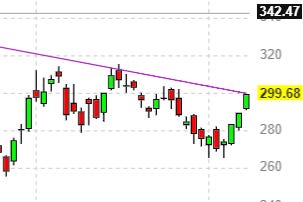
Related markets like TSLA approach that key trendline at 303 again. Chart D below.
Other related markets
TSLA
My key levels in Tesla will be 308. I think if we are going to have a bullish continuation further than this, we are going to need a D1 close above 308.
On the downside, I think 291 may offer some resistance if traded for a move back into 300. We last traded around 300 on TSLA.
ENPH
ENPH stock was shared by me with folks here around 150 and reiterated at 220 after it’s earnings, before this stock traded 320 dollars.
Most recently I shared 300 as LIS and the stock jumped around 2% off this level on Friday.
FREY
Not a huge fan of small caps but some set ups look appealing to the eye.
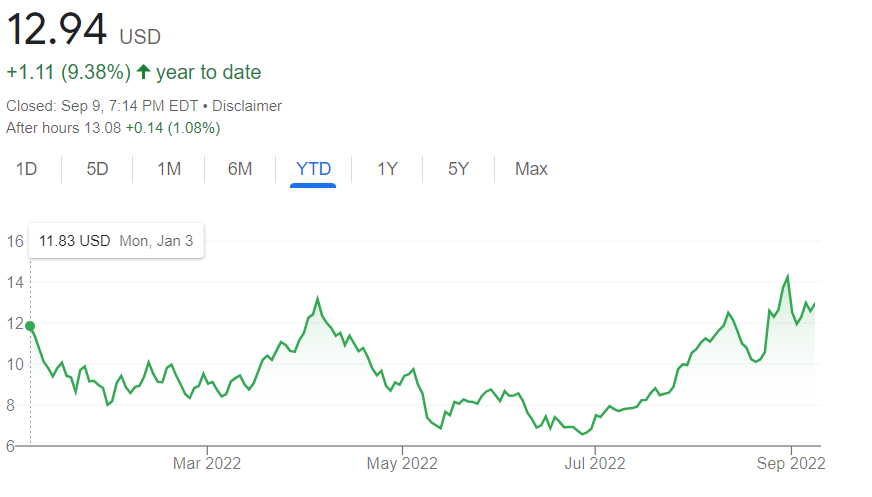
One such name is FREY. It is kind of stuck in this range of 8-13 and I think once/if it breaks, we may see 15-16, even 20 on this name.
Other names
A lot of names shared by me here continue to do very well - CI, PCG, ADM, CEG are just to name a few that I have shared within last one month or so.
I think one name which has piqued my interest is Pinterest PINS.
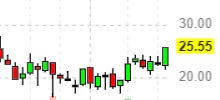
It is trading 25 now and I think this stock may be under accumulation for longer term.
I think any dips into 18-19 for this stock may be bought.
ADBE earnings
Adobe reports on the 15th AMC.
I have been bearish on Adobe for some time now and I think what is key is to see where the general market is pre earnings. If the general market is soft, and ADBE remains offered below $405, I think recent lows around 360-365 could be revisited. I do not want to be a ADBE bear pre earnings if the market strengthens above 4100 AND ADBE bids up above 405.
It is now trading around 395 dollars.
One of the things that sort of bamboozled me this week was the action in Dollar
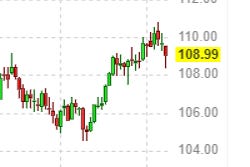
The dollar charts look slightly weak to me. I think the market prices in a FED pivot early next year, and it expects other Central Banks like the ECB to go after inflation hard now. As it is , the financial conditions in Euro area are tighter than in the US.
All in all, this makes Dollar looks little toppish to me.
However, I personally think this may not be as good for equities as every one thinks it is.
The ECB fight against inflation may plunge Europe into deep recession and the US may not be far behind. So I am not 100% sure if this Dollar weakness will benefit the US stocks a whole lot. We will have to find out!
A dollar weakness may be welcome by some other markets..
For instance, Oil.
This week, I was perhaps amongst handful who was still bullish on the oil at 83. This indeed turned out to be the correct call.
As a matter of fact I am predicting that minus a global economic rout, Oil is here to stay at 90-100 dollar range for most of this year and the next.
This I think will exert tremendous pressure on the global economy and it may as well put the world in deep recession next year.
The CAPEX in oil is very bad and I think it will become worst. No company is going to invest in Oil infra given the current political climate that is against fossil fuels and I think this will put some sort of floor under oil for a long time.
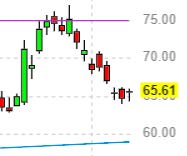
Though the oil stocks look a little toppy on the charts, I think as long as 90 on XOM, a 62-63 on OXY holds, we may see a retest of 70+.
At end of the day, the political will power is (still) strong to phase out the fossil fuel industry in favor of more green perceived technologies. The merits and usefulness of such an approach are beyond the scope of this newsletter, but I will say the higher the oil prices and thus the higher the energy costs stay, more the motivation for every day folks to move on to the solar and EV based transportation. The fulfillment of this goal is inherently inflationary which in turn means even higher energy costs which in turn mean even higher adoption of EV and solar. It feeds on itself.
As far as Gold is concerned
For me personally, Gold is just being punished unfairly and it is being treated as another currency which it is not. FWIW- Gold had a good week and I think if Dollar begins to climb down into 105 and below, Gold may have legs back to 1755-1760 area.
XME is aiding it and had a good day as well.
XME is now trading about 50 dollars and I think if 50 holds, it may make a run for 55-56 dollars.
Last but not the least my 2 cents on the CPI
I have no set views on the CPI , and I have no idea if it will come lower or higher than expected.
The consensus is for Month over month decline and the CPI to come in at 8% on annualized rate.
My opinion on this is actually about positioning. I think the market is positioned and front running the lower than expected CPI and it may be pricing in this at the moment.
What the market may not be pricing in is a hotter than expected CPI and I think that will be the true wild card which could lead to a very volatile Tuesday if the CPI tuned out to be hotter than expected above 8% on the year!
Wish everyone a great week ahead!
~ Tic
Disclaimer: This newsletter is not trading or investment advice, but for general informational purposes only. This newsletter represents my personal opinions which I am sharing publicly as my personal blog. Futures, stocks, bonds trading of any kind involves a lot of risk. No guarantee of any profit whatsoever is made. In fact, you may lose everything you have. So be very careful. I guarantee no profit whatsoever, You assume the entire cost and risk of any trading or investing activities you choose to undertake. You are solely responsible for making your own investment decisions. Owners/authors of this newsletter, its representatives, its principals, its moderators and its members, are NOT registered as securities broker-dealers or investment advisors either with the U.S. Securities and Exchange Commission, CFTC or with any other securities/regulatory authority. Consult with a registered investment advisor, broker-dealer, and/or financial advisor. Reading and using this newsletter or any of my publications, you are agreeing to these terms. Any screenshots used here are the courtesy of Ninja Trader, Think or Swim and/or Jigsaw. I am just an end user with no affiliations with them.





Appreciate your view. Would be great if you can post intra day update on telegram instead of twitter. Better update on telegram and I try to avoid unnecessary ppl point of view on twitter. 🙏🙏
Thanks Tic. This is superb analysis. Not just levels, this gives brilliant macro economic view. Helps your members to graduate to become good investors! 🙏🏼🙏🏼