S&P500 vs Inflation
Who Wins?
Folks-
All we hear about now a days is INFLATION! I am personally not seeing a lot of good input on the relation between inflation and stocks! I wanted to find out first hand how the stocks may perform when CPI gets this high, that is to say current range of 8-9%.
Note this analysis is only valid for these periods where the inflation while very high, is still manageable in the sense it is not hyper inflation. In hyper inflationary times the purchasing power of the currency can get cut in half every few months. Those times indeed tend to be extremely bullish for the stocks as the stocks make new highs while the currency makes new lows every day pretty much - look at Zimbabwe and Argentina for example in recent memory.
To do this analysis, the only comparable period I found in recent memory in the US was that of 1970 to 1980.
Many of us were not born then, so I had to go back look up inflation data as well as the S&P500 price performance amongst which markets did better compared to the S&P500. For S&P500 prices, I selected the monthly close prices but it suffices to say it represents the range of price quite well.
What was inflation like in the 1970s?
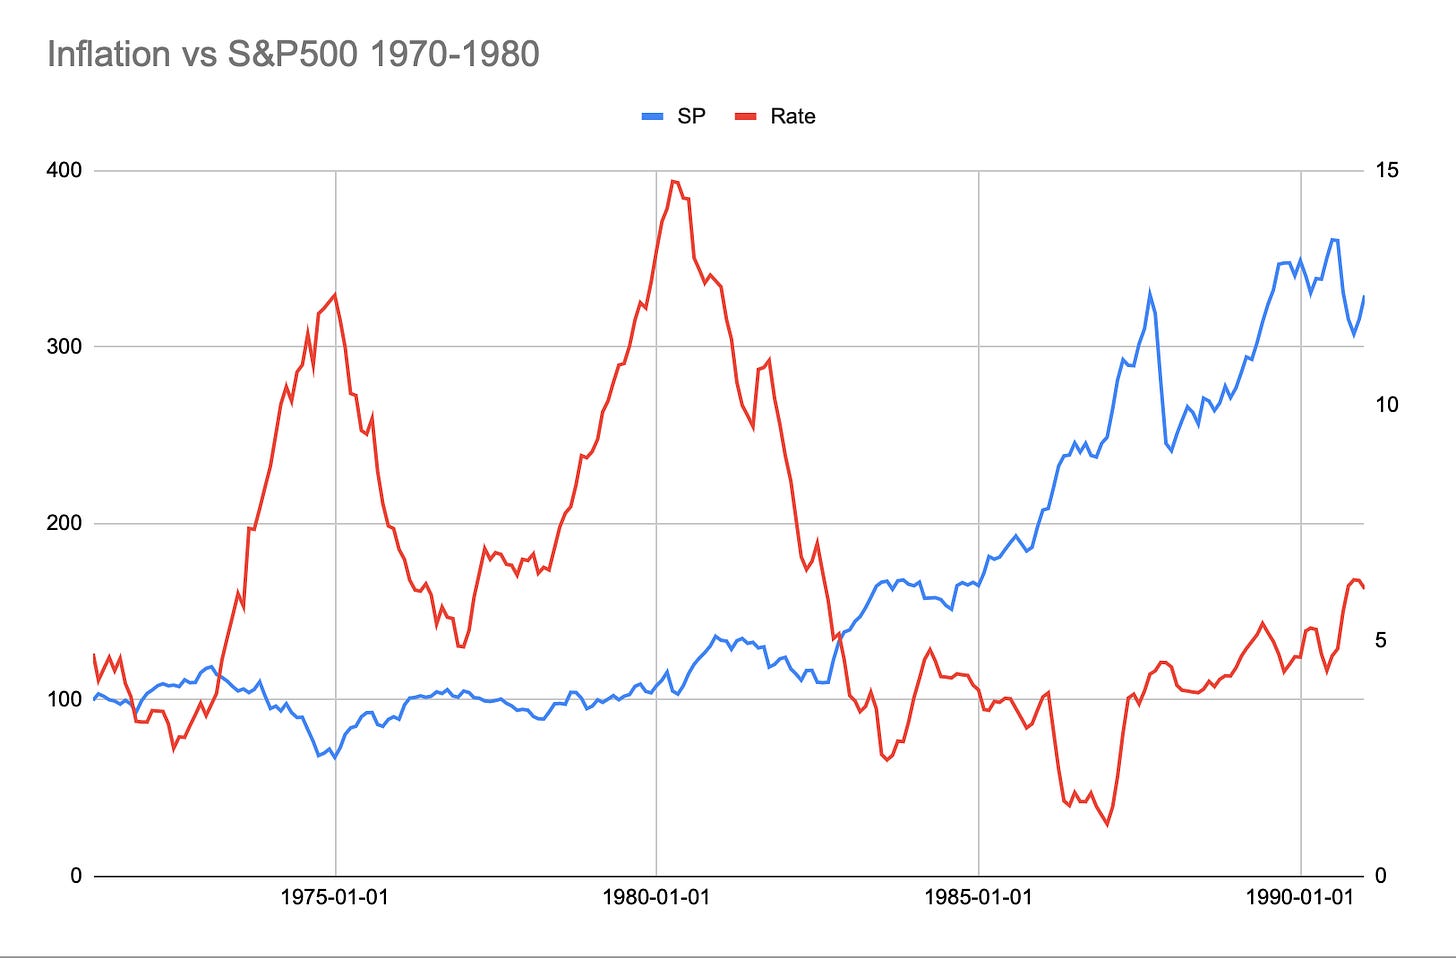
Here in figure A you can see the inflation between 1970 and 1980 for most part ranged between 5% and almost 15% with 5 % rather being the low end of it. So very high, persistent inflation with brief periods of respite.
How did S&P500 do during this same period?
Well, it did not do much.
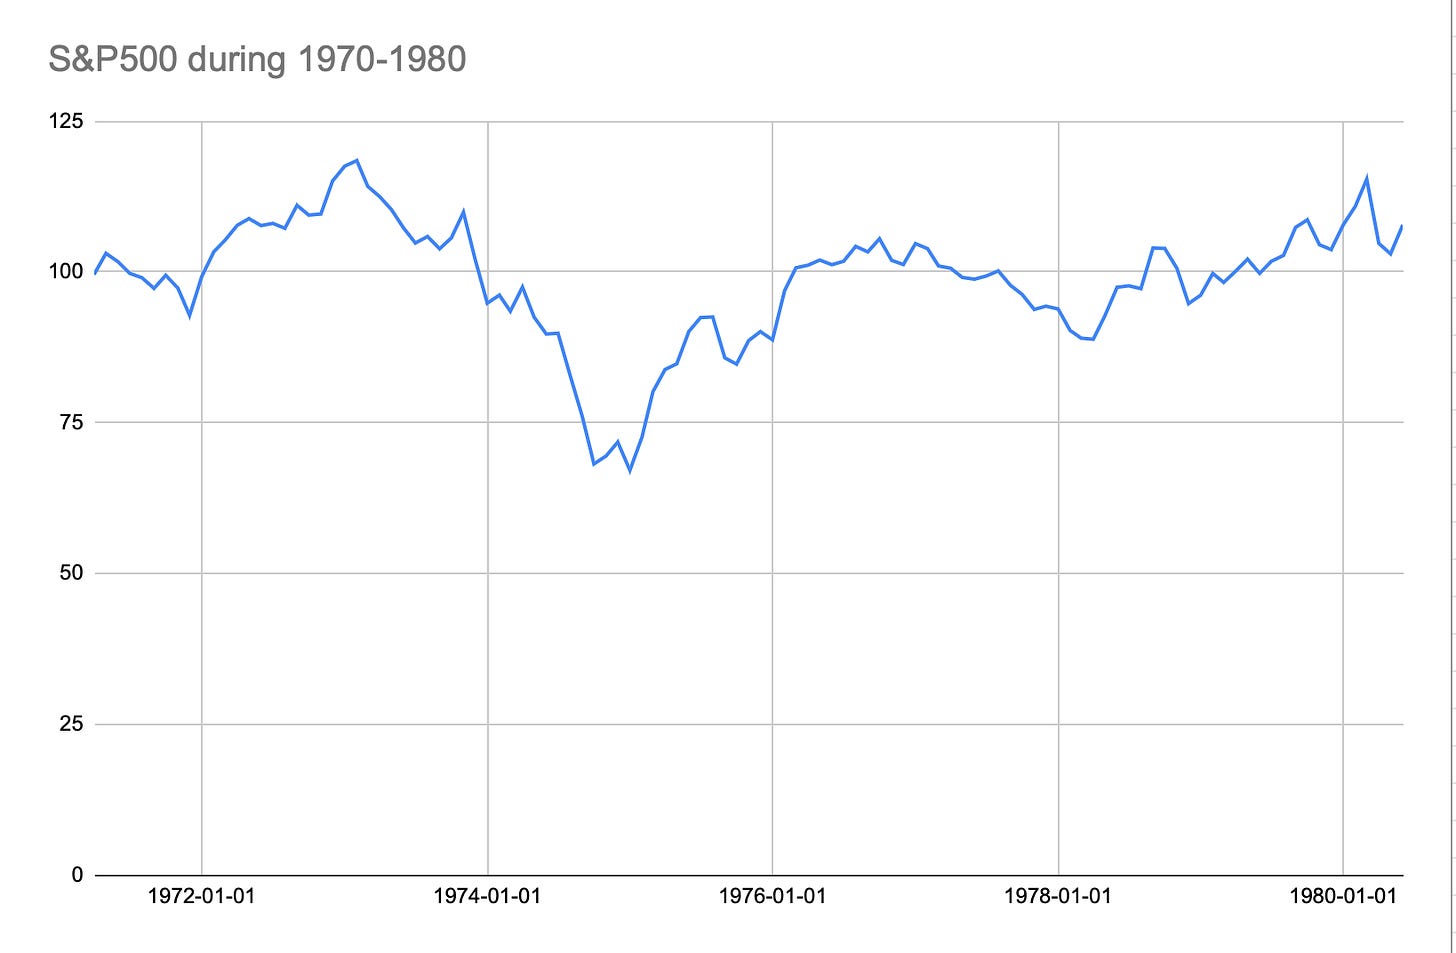
See Chart B with the S&P500 go no where for 10 years as it opened and closed around 100 dollars . In fact the return was around -10%. DOW JONES opened AND closed at 800! Nothing to show for 10 years!
The only solace I take in this is that it was 100 then and it is almost 4000 now! So for any one with sufficiently long time frame, it may still work out if they HODL long enough. 0DTE? Tough luck guys :)
Looking at high inflation and the S&P500
They seem to have an inverse releationship. Persistent High inflation = problem for S&P500. Chart C below. Left (Blue) is S&P500 . Right (Orange) axis is inflation rate.
What will have done better under this period?
Both real estate and energy stocks like the oil stocks did very well.
Oil returned around 80% and REITS returned around 20% in this same period when S&P500 shed about 20%. Land and real estate were huge winners.
What else did good?
Gold and silver had tremendous runs in this decade rising about 10X. Gold was about 30 dollars to the ounce at start of the 1970 and it closed the decade at about 400.
Commodities like grain, wheat, corn and livestock did very well. So anything really physical, hard assets outperformed other assets during this decade.
Energy , grains and RE already have had great returns this one year. Gold and Silver seems to be the only laggards.
Are we really in the 1970s, 50 years later in 2020s?
It depends but there are definitely some parallels.
Like today we had very high inflation. Like today we had very high debt. However unlike today we also had higher unemployment. You could argue that this could catch up as the time goes and that may be a fair point.
Also consider what finally turned the tide on high inflation?
Well at the start of 1979, Chinese markets opened up to the world and China started exporting deflation and it started gnawing at the high US inflation. At start of this decade, 40 years later I see that trend now reverses. China is shutting down - involuntary or by design remains to be seen but they are actually now exporting inflation rather than deflation in form of curbed supply chains.
When you look at the oil, you see parallels to 1970. CAPEX has been limited in the oil, renewable energy is just NOT there yet to meet the demand and add to the mix an unfriendly regime to the fossil fuels- this is perfect recipe for sustained energy costs for time to come.
My conclusion:
Based on these factors and historic parallels, I think unless the inflation were to come down significantly this may very well be a lost decade for the S&P500 and its high flying growth stocks and mega caps which all happen to be growth names.
When did this tide turn?
S&P500 started picking up after 1980 when inflation started coming back below 5%. See chart D below. 1980 in fact was a great bull market in the S&P500, probably made possible by that collapse in inflation below 5%.
I was my self curious about this topic and wanted to do a deeper dive into previous high inflationary times using correlated markets. This is my personal journal and research which I am happy to share. This is not a recommendation or advice to do any thing. This is certainly not a call to the 0DTE gang to load up on the puts :)
Subscribe and share my newsletter below for similar insights by me when they are published.
~ Tic Toc
Disclaimer: This newsletter is not trading or investment advice, but for general informational purposes only. This newsletter represents my personal opinions which I am sharing publicly as my personal blog. Futures, stocks, bonds trading of any kind involves a lot of risk. No guarantee of any profit whatsoever is made. In fact, you may lose everything you have. So be very careful. I guarantee no profit whatsoever, You assume the entire cost and risk of any trading or investing activities you choose to undertake. You are solely responsible for making your own investment decisions. Owners/authors of this newsletter, its representatives, its principals, its moderators and its members, are NOT registered as securities broker-dealers or investment advisors either with the U.S. Securities and Exchange Commission, CFTC or with any other securities/regulatory authority. Consult with a registered investment advisor, broker-dealer, and/or financial advisor. Reading and using this newsletter or any of my publications, you are agreeing to these terms. Any screenshots used here are the courtesy of Ninja Trader, Think or Swim and/or Jigsaw. I am just an end user with no affiliations with them.


Good comparison/analysis but only difference between now and 1970/80 are as follow:
1) $ value decay. I think back than $ was backed by Gold but not anymore and they just keep printing it and it keep loosing the value
2) unlimited $$ printing led so much inflation in spx/nq component prices, so the asset prices are not organic enough and may get into fundamentals/value test
3) national debt is way too high now and there is no easy way out to reduce it unless we go with 50% tax rate for all 😂
4) raising oil and other commodity prices
5) threat of major geopolitical event
6) extremely high consumer debt and other personal debts but limited wage growth, so there is a gap there
Just few other point we can use for comparison and its potential impacts on spx.
This post helps understand parts of the macro thesis, appreciate it, would love to see more 🔗 posts from here to impacts of Dollar, Oil, Debt holding countries like China and Japan on US market.
Is Japan unwinding US debt slowly, how does that relate to Dollar and Oil. Some things I've been studying and would love to hear more from your PoV. This is purely for LT investment goals.
It feels like Investors need to be mindful of the risk of tapering globalization, primarily led by China 🤝 Russia 🤝 India and Saudis and others on the fringes, vs consumer economies like the US and EU.
China thinks in several decades and it 🤔 they have a plan, they have most of the ingredients to go "vertical" with the other countries, whereas US and especially EU need to figure out a lot more. I have somewhat high conviction China will take Taiwan before Midterms sensing an opportune time of weakness from US and Cornpop. That means TSMC, which means impacts to many many darling mega caps.. I want to assume this cannot happen, but it's definitely the 🃏 on the table for 🇺🇸 vs. 🇨🇳