Hey traders, hope everyone had a great week last week and is super charged for the week ahead, albeit holiday shortened!
I was personally quite bearish last week and in my weekly plan (link here) I called a test for the recent swing lows at 3800.
Not only I was bearish on the equity index, I was also bearish on major stocks like TSLA, AAPL, and Bitcoin.
All of these bearish ideas were documented in my prior weekly plan and came to fruition this week with Bitcoin being the hardest hit, losing more than a 3rd of its value off the levels shared by me.
In this installment of the weekly plan, I will be sharing whether I am bullish or bearish on the SPY this week, my thoughts on Bitcoin, as well as I am going to be sharing about 6 long term stocks which I am watching and waiting to buy for long term investments and what levels I will be bullish on them. This includes some names like TSLA, AXP, COIN, CVNA and many more, including some Oil stocks.
Subscribe below today for up-to 5 similar plans every week.
Starting with my thoughts on the S&P500
Let me paraphrase my longer term bias on the S&P500 for providing context for any one who may be a new reader to this newsletter. I became a bear on the ARKK type growth names back in last Fall and I became a serious S&P500 bear in January of this year at 4800.
My view that we are in a longer term bear market has not changed yet since beginning of this year, with the caveat that we can and have been forming mega ranges while we continue to chip away at the downside. While a lot of folks have declared an end, a rather premature end to the bear market, I have been quite steady on the downside and my levels whether that is a 4636 or a 4200 have proven to be good resistances.
What could be a brand new resistance in SPY? Read on to find out my own thoughts on it.
For example, the very first range shared by me in this downtrend back in January it self was 4200 to 4600. This held quite well for a number of weeks before breaking lower in May to 3800.
It is here that I shared a new range between 3800-4200. Now obviously this week we have broken this lower end of the range and are now trading quite close to 3600. So, longer term I am not yet in the camp that says we may have seen the lows in the indices. And it is to this end that I will share about 5-6 names on my radar and their associated buy points which I will be watching over next several weeks and months.
However, shorter term, it is quite common for the S&P500 to stage 10-12% counter trend rallies in a bear markets and similar pullbacks in a bull market.
I do not think this cycle is any different.
What is different however is the speed at which this bear market has been moving. Immediately after we had that rally post FOMC into 3830, I mentioned in one of my daily plans that I do not see this thing have legs past 3830-3850. In fact that 3830 turned out to be the high and the moment I sent out my daily newsletter, we started selling off in the index and traded down almost 200 handles into 3640.
Look at Chart A below. Long term readers who are familiar with my methodology know how significant these gaps can be for a momentum trader like my self. These gaps are almost always filled. However when they occur on a very deeply liquid market like the SPY and they dont fill for an extended period of time, they only add to the downside momentum. And this is exactly what has been going on in terms of speed and intensity of this downward move. It is very rare for so many clusters of these gaps to form in a very liquid market and the fact that they have formed and remain unfilled weeks later shows how soft this market has been.
BTW gaps can be very important clues about health of a market and if you have not , I encourage that you read up on the educational post I wrote about these gaps at the link below.
Now in my approach, I look at a few things when coming up with my levels and scenarios..
Orderflow.. in fact orderflow observed on a level 2 tool like a DOM is the primary tool I use to derive my levels
Related markets .. related markets like what are the bonds up to or what are the currencies and commodities doing in relation to the indices is another important reference for me.
Technicals and sentiment.. I do not use the technical analysis in the strict sense but I do look at longer term weekly charts on many of the markets I trade. I also leverage sentiment.
Obviously, when all three of these factors align, the signals tend to be the strongest. They do not align at all the times but that does not mean the signal is not tradeable , it is just that it could have been stronger.
Looking at some of the related markets then..
TLT
TLT had a very good bounce off the lows and then it kind of stalled at 112. I am surprised the equities did not get a good bounce off this. If this starts coming off next week, I think it is likely to add pressure on the index.
Oil
Crude oil also did sell off. A lot.
It settled around 109.
Look , here is how I look at this whole oil and inflation picture. I do not think the oil is going to come down a lot below 100 on its own (like in a traditional supply vs demand scenario).
The main issue as I see with oil is the industry itself has not invested much in capacity increases over the years and decades. Why would they? If you are a legacy industry and you believe you are going to be obsolete in a decade or two, you stop investing in long term CAPEX. So that means, if the demand as it is right now, if it stays constant or even slightly increases, the supply is not about to catch up with it any time soon. This may keep oil above 100-110 for several months which means oil as the primary input in any industrial process, may keep inflation up in these core processes and products.
I will be quite surprised if oil falls below 100 any time soon. I think I will be surprised if oil falls below 100 even if there were to be an outright recession here in the US. Now if the war ended, if a deflationary bust takes hold globally then I could see that scenario! And that will not be good for any one anyways - certainly not help the equities if it came off in that scenario.
Gold
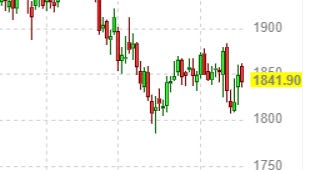
The 3rd culprit in this is the shiny metal it self. It has stubbornly remained below 1850. Many are celebrating this as a sure shot sign of end of inflation. I dont know about that. I think Gold is simply down because dollar is too strong. Once dollar starts coming off, I think IMO we will see a large run in Gold to 2000-2200.
What I see with these 3 key related markets is that they had a favorable tint to the equities this past week. The equities should have rallied strongly off the correlations - but they did not. May be the orderflow was too weak?
Bitcoin
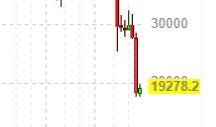
Bitcoin which I have been a longer term bear off 52K collapsed this week. Within a matter of few days it fell from 30K+ to around 17500 where at time of this post, it managed to have found some succor.
Look, in my view, as a nascent industry, the whole complex around Crypto and blockchain is key. The US has an edge in this and I think it will be foolish to squander that edge away. This tech potentially has a bright future.
Now in my own view, I think the way you pay on the internet is ancient. It is archaic and arbitrary. I think there has to be a better way to pay than just PayPal or Credit cards and all the associated fees you end up shedding at the APP store. Like Apple charges 30% in most instances just to facilitate the payment between the creator and the consumer. All ridiculous. So yes this payment industry alone is ripe for disruption and I think that is one small use case for blockchain. Now I do not think that Bitcoin is the answer either- it is too cumbersome. It is very slow to be of any meaningful use to payments which can often average billions of dollars transferred every few minutes worldwide. Bitcoin therefore is like the MySpace of this whole ecosystem. This is why the supporters call it “the Digital Gold”. Because that has a connotation as having some sort of investment value outside of pure utility as a payment platform. Anyways, I wanted to share this background to lay my case that there is value in this space but there will be better alternatives to be in this than Bitcoin. I sure hope to educate my self more in this and find and share with you what those may be.
Now as far as Bitcoin is concerned, it has taken out the prior high watermark and I think as long as it stays below 20K, it may act as a resistance. I think it wont outright drop to the lows without a fight and I am eyeing 12000 as a key level where it may find good support for a move back up to 20-22K.
I also wanted to include this blurb about BTC in my analysis for the Spooz next week as I believe if Bitcoin were to open here or below 18-19K , I think it may add pressure on Nasdaq and Spooz on Tuesday at the open.
Looking at some technicals
Chart B below shows another balanced day on Friday. After falling huge off my 3830 post FOMC, the market has settled between 3650 and 3700 for two days now , both levels shared by me on Wednesday with the folks here.
In general I do not like this balancing here at the lows which often shows a lack of interest. More on this later.
Putting the orderflow, the related markets and the technicals in context, I think both 3700 and 3650/3666 are key levels for next week.
My primary view is that we are readying to fill some gaps overhead at 3900 and then at 4000. However, as long as we keep balancing here at the lows under 3700, further downside of 3-4% may not be ruled out. What is important for the bulls is the defense of 3666. They do not want to lose this. As long as they can defend this 3666, I will expect at some point we may be able to close above 3700 in the D1 time frame and retest the recent FOMC highs at 3830.
I am going to split the auction next week into 2 distinct levels/zones:
Scenario 1: I think as long as we remain below 3700, there may be a tendency to retest and break the lows around 3650. If these lows are broken, I can see us trade down into 3550. Any prints I think into 3550 will be excess for me personally and I would like to most likely buy it for a expected test of 3800-3900.
Scenario 2: A Tuesday open above 3700 or a close above 3700 indicates to me that we are ready to test post FOMC highs at 3830 again. If we manage to close on D1 time frame above 3850, we may be able to close some of the gaps at 3900-4000.
To summarize: I think the market having broken that 3800 range low is now in process of finding a new range. I would have thought that new range was 3650-4000 had the related markets and the technicals not been this weak. The fact that we closed below 3700 again on Friday indicates to me the market may want to test 3550 area and form a range between 3550-4000 IF it is able to break these 3650/3666 lows. Had we not closed below 3700 on Friday, I would have had more confidence that I do right now that we may test 3900 next.
In this context, the bulls , if they can manage a close above 3700 can expect a test of 3830 and in fact a close above 3850 opens the door to filling some of the gaps at 3900. Conversely, as long as we remain below 3700, the market energy remains focused on 35XX handles.
Look, you will hear from a lot of talking heads how this is is the bottom and how we have see the peaks in issue facing us whether that is inflation or supply chain. They may be right - however take everything they say with a grain of salt. Some of these folks proclaiming the bottom is in themselves are invested in such a bottom being found. Like if I manage an ETF, then yes I want the bottom to be here sooner than never. However when you look at the flows, the technicals or the related markets , there may be a little bit more fly in the ointment still left.
The argument you hear a lot is how the financial conditions have tightened and how this will lower inflation. The key word here is “will”. Are we seeing any signs yet of inflation abating? Even if the stock market comes down, a lot of core CPI is due to gas prices. Are gas prices coming down any meaningfully? Are the rents coming down any meaningfully? I think if I start seeing gas come down below 4-4.25 dollars nationally, I can say that inflation may be coming down. Not until then.
Some longer term auctions
This brings me to the section where I see a few stocks and what prices I feel comfortable in buying them for my self for long term buy and hold.
Now remember in any of these the time frame matters the most. If these prices get tradeable, my minimum time frame in any of these will be 2 years. Again, the purpose of these levels is for me to be cognizant of where the market may go longer term. I do think if there is a longer term bottom in the general market, it may coincide with some of these levels in these names.
Many of these prices are 10-20% out still from current levels. I do think these prices will become tradable in near term however I will revisit these and share an update if I see the orderflow change to warrant revising some of these prices down. Or a bit up. So stay tuned!
META
I recently shared 163 level on META which in itself I thought was a decent level. We rallied almost to 170 from here before giving up those gains to settle back around 163. I do think a META at 150 level is quite decent for me personally from a risk to reward. This stock has taken it on the chin compared to other mega caps and I think part of it was or a large part was due to being too early on the whole Metaverse scene.
NFLX
I have been a long term NFLX bear from 530 level . It is now trading down into 175. I think once/if the overall market stabilizes, NFLX has sold off quite a bit unfairly and a 160-163 could be a good level for me if my time frame was 2-3 years or more.
There could be more of these tickers that may show up on my radar in near term, and when they do, I will be sharing them over here. Subscribe below to stay on top of whenever these are published.
DIS
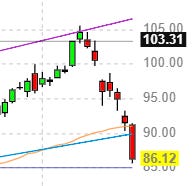
Disney sold off very aggressively from my 144 bearish level and ended the week around 94. IMO DIS has several problems , not just the economy or consumer related. I think their main issue, bigger than consumer issue is the issue around content. They have to get their content right and deliver what folks really want. I will begin to warm to this stock around 76-78.
AXP
I like AXP amongst the XLF stocks but they do have a very heavy debt load in a rising rate environment. I think it remains under pressure as long as the stock remains below 160 (now 144).
My target on this and eventually I think a good point for me on this will be 116-117.
TSLA
TSLA is yet another one of my favorite tech stocks but I think for the 3 reasons I shared in last week’s plan the stock may remain under pressure below 700.
It is about 657 now but I think it becomes attractive to me around 546-547.
Per my prior daily post, there are certain levels which I keep a note of in many markets where the price becomes too low for me personally and I have to put a foot down and say “ok I like this here at 95 or a 100 and I know if I get in here now I will probably go thru a 10-12% drawdown” . Many of these names I shared may soon approaching those levels. Yes we are not there yet but I think if this market remains weak like this for another few weeks, we will be at these levels in several of the markets that I trade personally.
Few other names
I am also keeping an eye on a couple of tactical plays which just have been sold off a lot and could see a bounce in the short term.
CVNA
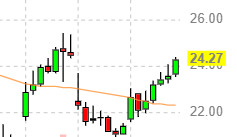
I think if Carvana holds that 21-22 and the general market supports, it could make a run for 28-30.
COIN
I think if Bitcoin sell off can abate and as long as COIN sees a support of 47/48 (now 51), I can personally see if rally back to 68/70. I would not want to see Bitcoin break 17500 for this to come to fruition. So in that sense BTC 17500 support is key for Coinbase.
What about you , do you like any of these names or is there any ideas you want to share with me ? Let me know below.
Another look at the oil stocks
As I suspected and as it turned out to be unfortunately for late bulls, a lot of talking TV heads and pundits got very bullish in oil stocks at very high prices.
In fact I warned about this for XOM and OXY at 105 and 75 dollars respectively. Both of these turned out to be the exact highs of the moves.
XOM has now sold down a solid 20 dollars into 85 bucks. Can this be the low?
I dont know. I think with strong downward momentum I think a 80 would be a better spot for me.
Outside of these, I am personally not seeing a lot of great opportunities this week either. I know XLE was a last refuge kind of place where many flocked to, and it got decimated too. With XLE gone, and some of these other sectors like XLF and XLK only halfway thru potentially another leg down , I am not seeing a lot of great names pop up on my radar this week either.
I hope this changes as soon as we start seeing a meaningful low in the oil and we begin seeing dollar come off some of these highs we are seeing. It is certainly not this week IMO or the next, but when it does show up, I expect it to show up on the tape first.
Have a great week trading, stay nimble, stay safe.
~ Tic Toc
Disclaimer: This newsletter is not trading or investment advice, but for general informational purposes only. This newsletter represents my personal opinions which I am sharing publicly as my personal blog. Futures, stocks, bonds trading of any kind involves a lot of risk. No guarantee of any profit whatsoever is made. In fact, you may lose everything you have. So be very careful. I guarantee no profit whatsoever, You assume the entire cost and risk of any trading or investing activities you choose to undertake. You are solely responsible for making your own investment decisions. Owners/authors of this newsletter, its representatives, its principals, its moderators and its members, are NOT registered as securities broker-dealers or investment advisors either with the U.S. Securities and Exchange Commission, CFTC or with any other securities/regulatory authority. Consult with a registered investment advisor, broker-dealer, and/or financial advisor. Reading and using this newsletter or any of my publications, you are agreeing to these terms. Any screenshots used here are the courtesy of Ninja Trader, Think or Swim and/or Jigsaw. I am just an end user with no affiliations with them.


Patiently waiting for that 3830 and 4000🤓
Thanks Tic as always. What a long and interesting newsletter. Isn't btc trading at 20250 right now? I'm concern about your levels, and wondering if you also look at btc at a certain time, like IB... thanks Tic, appreciate every word, lots of substance to digest.