Folks-
After the last week’s action in the market, many have the same question as I have…
Over the weekend, I spoke with several family and friends who had the same question…
Will there ever be a pullback of even half a percent in the stocks now? Is there any hope left for the bears, or is it all over now? I have grappled with these questions all week and am now ready to share my 2 cents on the topic.
But before we get into that, I have a little background on my thinking before now for newer readers.
For most of 2022, I was bearish on the stocks right from the start of January when S&P500 was trading at 4800. While I remained bearish on longer time frames, I did share my inflection point levels at least 4 or 5 times in 2022 when I turned bullish on swing time frames, and each one of those ranges was like 500 or so S&P500 points - both up and down from my levels with very little activity outside of those levels.
Most recently, I had been bullish on smaller time frames near 3800 at the time of the regional banking crisis in March, and I had expected a test of 4050-4200.
However, I had also expected sellers to begin moving-in near the 4050-4200 range for a retest of that 3800.
While I was correct to be bullish at 3800, the 2nd part of my thesis has not come to fruition now that the S&P500 is trading near 4400. Buyers have been very aggressive compared to the sellers. In some markets like TSLA, the market has not seen a down day in over 3 weeks. Nonstop, one-way auction. To the upside.
I do not believe in postmortems in market speculation.
You could have a very reasoned-out and robust analytical framework, which may come down to nothing in the markets. All the effort and research may be vain and the market humbles you.
Such are the markets. Every day is different, every session is unique and you just do not know what you will find. Adapt to this. Or move on.
This is why I am ok with holding strong beliefs, but I also believe in having flexible execution. Once a market has gone against me by 10-15% from my levels, I know from experience with my levels that it could go more against me once that 10-15% threshold is crossed. This is why I am a strong advocate of using 10-15% ATR-based stops in my personal timeframes.
Macro calls are very different from technical calls.
Macro calls are notoriously hard to time just because it is hard to see Macro, unlike price action, which is pretty real-time and pretty objective for most observers.
For instance, I began to see bearish calls and sentiment build up in 2005. This was two years before the housing market collapsed in the 2007-2008 Great Recession. If you bring up the 2005-2006 charts, you will be considered ludicrously ridiculous, being bearish based on those charts. So many of these bears in 2005 were extremely wrong for over two years before being very right, finally during the final few months of the actual crisis (the markdown phase).
I personally think 1-2 years is a good time frame for a macro call to play out. Anything less than a year, I think, is premature.
I am sharing this as a backdrop to my question earlier if the bears have any chance now.
S&P500 is now up about 15% on the year. QQQ performance is even more impressive at 38% for YTD.
Amidst such stellar performance numbers, the argument that we can see the markets now sell off may seem far-fetched.
I personally see two instances where the bearish trend could still get going -
1- Inflation re-accelerates
US June CPI is now almost four weeks out and will be released on the 12th of July. The only other key inflation data to hit the wires will be the core PCE on June 30th. I think this is a real possibility as long as the unemployment rates are quite low that we see inflation tick up again. June CPI may yet come in lower as the 2022 June data will drop off next month. However, I do think the CPI following July could come in hotter than expected.
Now it is a valid argument that if you look at Europe, especially if you look at the UK, the FTSE stock index has been making new highs despite inflation being close to 10%, which is double the rate of the US currently.
There, however, is a very key difference between the UK and the US.
Can you guess it?
The UK Bank of England rate is nearly half the current inflation rate in that country at 4.5%. In a sense, you could be forgiven for thinking that the Bank of England has already given up its fight against inflation, that it has surrendered. This could be one factor.
The other important factor may also be that in FTSE, 2 of the largest companies are oil companies which have been making record profits. FTSE has a very small technology footprint, if any. Compared to the US markets, which are dominated by Big Tech. Oil is a contributor to inflation. Tech products create leverage and productivity which in turn can create deflation in some products and services.
So, it is not too far-fetched to see why the FTSE may be making new highs despite 10% inflation and recession in UK.
In the US, the spread between the current CPI and FED funds rate is narrower. UK is also highly tech-focused. Tech tends to be very sensitive to interest rates compared to the oil companies- so if we are going to see 4-5% rates for another year or two that could be a big headwind for these stocks.
Being Tech heavy has its benefits too.
For instance, prior to last week, most of the gains in S&P500 have come from TOP 5 or so companies like NVDA, AAPL, MSFT, etc, which have themselves ballooned a lot due to the AI boom. These AI companies have added trillions in market cap to these companies almost within weeks.
Another factor unique to the US market is just the sheer size of its debt owed by private as well as public sectors.
So due to all of these factors, I think the US market is going to be more sensitive to any uptick if we see one in the inflation picture.
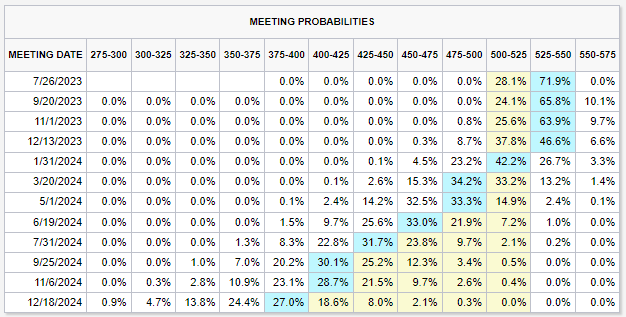
Chart A below.
We see a 70% chance of a rate hike in July, and we see a large probability of rate cuts starting with the March 2024 meeting. Of course, these can change at any time, but remember, we were already pricing in rate cuts this Summer, and they have now been pushed out to at least early next year. Furthermore, there is less than a 10% probability of the FED funds rate ever reaching 5.6% as stated by Powell himself. This is a large shift in expectations.
2- Liquidity drain.
FED funds rate right now is front and center of all FED conversation. However, there is a real issue of liquidity drain in the next few months, which does not get enough mention.
Yes, the FED asset roll off has slowed down since March, but it could pick up steam again. We also have treasury offering more debt in the next few months, which will suck ample liquidity out of the banks.
One may ask, does this all really matter when the market is pretty much one-time framing up?
I think it does. Why?
Unlike previous bull markets where the FED was actively buying up assets themselves like there is no tomorrow, right now, it is supposedly selling assets. Yes, the markets are going up, and it is going up because there is buying, but a lot of this buying is from individual investors who are front-running a FED pivot that may or may not come.
From FED’s perspective, they had to roll off their balance sheet anyway. They always wanted to do this. A 9% US inflation was just a detour on the way. I think they will continue to aggressively roll off their assets whether inflation is high or at target. I think they will stop if and only if there is a major systemic breakdown like the one we saw in March.
The largest 3 out of 5 bank failures in the last 15 years have happened this year.
So purely in dollar figures, this is quite a large systemic failure. So I think it made sense from a FED perspective to take a pause this month, but I think if inflation ticks up again, we could see a July rate hike at the very least if not two more.
So these factors, I think, are key allies of bears I still think and as long as these two threats are not neutralized, we may not yet have seen the end of volatility.
Personally, in my view, the current market strength is due to technical strength - which does not make any less of an impressive price movement, but when you want to talk about the sustainability of this market, I think one can not ignore other important factors like Quantitative Tightening.
My Emini S&P500 levels for next week
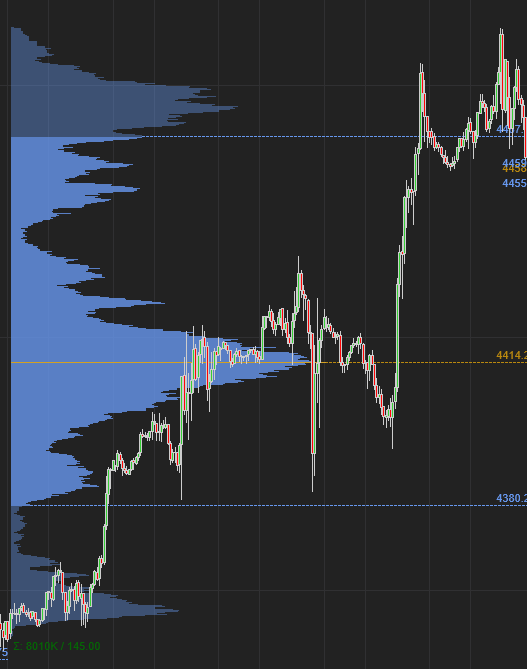
Chart B shows a multi-node, heavy-volume Emini Weekly Profile.
Next week, Wednesday and Thursday are the key event risks when the FED Chair Powell testifies.
Often times Powell will walk back what he said during the FOMC in these testimonies, which could cause additional volatility on days that he speaks. That is something I can listen to on a squawk box whenever he speaks.
Other than that, it is an event-light week with a Monday bank holiday and a holiday-shortened week.
My key levels will be 4495 AND 4410. We last traded 4455 on Friday. These are all September contract numbers for the Emini S&P500. SPX close was 4410 on Friday. So the key level will be around 4450 on the SPX index.
Scenario 1: I expect some resistance to come near 4495 for a retest of the 4410 area.
Scenario 2: We could see a directional trend move above 4495 to test 4540 or below 4410 to target 4360.
Slightly longer term, I think the Bears do need to hold this 4495. I think if they are able to keep the week capped below 4495, we could see a deeper sell-off. This may be an important level for both the bulls and the bears next few days.
These are exclusive levels based on level 2 Depth of Market analysis and are available only on Substack, nowhere else. Not on Twitter. Not on Truth Social. Only Substack.
These, along with names like GME, TSLA 0.00%↑, CVNA 0.00%↑ , TGT, LYFT, BUD, HOOD, PYPL, BABA, VIPS - several dozen more shared in the last couple of weeks alone.
This concludes the section for Emini S&P500 levels.
Volume profile in any market is a great analytical research tool, especially in NQ and Emini. Volume profiles and composite volume profiles can often provide support and resistance levels in many time frames. If you have not yet, check out the post below.
In the next section, I am sharing some of the names like TSLA, PLTR etc which look interesting to me from a technical perspective.
CVNA
So, CVNA has been a great run this year. I had originally shared my bullish bias on this at around 3 dollars and then again at 11 before it rallied to around 30 dollars.
Most recently, I had warned against being bearish on this at 18 bucks, and it almost rallied 33% this week alone.
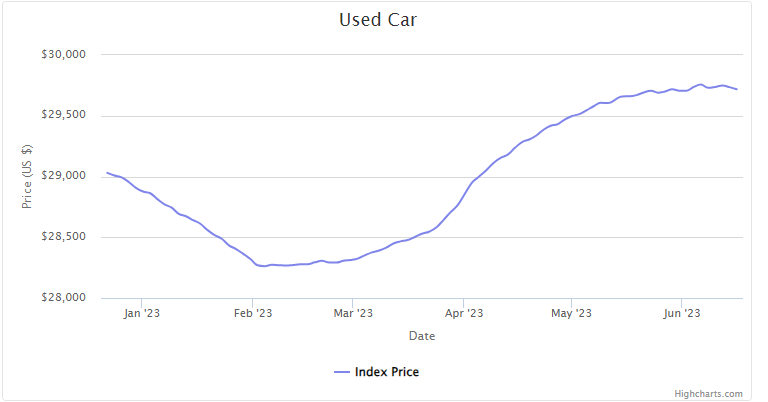
Part of what has been helping CVNA is the prices of used cars themselves, as they have been on an upswing. Then there are other factors like tremendous short float on this stock.
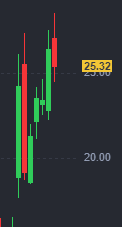
I think CVNA may remain supported as long as this gap around 18 dollar area holds. See Chart C below. This is a key level that CVNA bears need to take out IMO.
WE
WeWork Inc. represents the hysteria and great bubble of pandemic-fueled excesses. This stock once used to be a 15-dollar stock and is now trading near 15 cents, down some 98% from its glorious highs.
Of late, it has been ranging between 15 and 25 cents.
When I look at something like WE, I simultaneously see something teetering on the verge of extinction, but also I am quite fascinated by its inherent potential. This stock is down like 99% off its highs, and it does not mean it can not go down another 99% from here. However, there are a few factors that I think may help it.
I think there is going to be an ongoing theme of moving away from 50000 square feet office building leases and instead renting out more personal working spaces. I also think there is going to be a trend of reopening post-COVID, and that may mean more folks going back onsite to work rather than at home. These factors may be beneficial for something like a WE.
I think it is one of those names that is either zero or a hero with no middle ground. If someone told me a year from now that WeWork went to 0, I would not be surprised. If someone told me WeWork went to 2 dollars in a year or two, I would not be surprised either.
Folks, if you enjoy this newsletter, make sure you connect your own newsletter to mine and let me know. Also, as always, remember this is my personal journal, where I document my own levels and thoughts every week for planning purposes, and I am happy to share these with folks in the form of this blog.
One of the positive side effects of this market rally has been just the sheer number of bullish setups in individual stock names, which I was able to share in the last 2-3 weeks. This has been quite a good period for anyone who is an active trader. Again this is not a normal distribution in terms of the frequency of these moves. However, I do think this will probably not last. You could either see the general market reverse here, which means we will see a larger number of stocks begin making a move to the South, or we could see the general market slow down, which could mean the number of movers like CVNA or a TSLA dries up. I personally favor the market to move- whether up or down as it becomes very hard for me to remain focussed when the average moves dry up to a handful of points a day.
TSLA
Tesla is yet another example of excellent market moves from a good value area.
I was very bullish on TSLA at the start of the year, around 100 dollars before it doubled. Recently I have been a TSLA bull for around 200 dollars (190 to be exact), and this stock has risen 50% this month alone!
Can this insane run continue?


