Folks-
Friday capped a violent end to a tumultuous week. A bear market was officially born in the S&P500 market which was relatively short lived for about an hour or so on late Friday PM. By bear market I meant the official definition of a 20% or more drawdown from the highs.
Note if this post does not open in email, it may be too long for your email client. Try opening this in a browser or get the APP below.
The 3 times leveraged SPX ETF, SPXL came very close to filling that COVID MARCH 2020 gap BUT missed it by about a dollar. Is this gap fill when we stop selling?
In this week’s plan, I have 3 sections to cover:
A recap of my prior weekly plan
My thoughts on if this bear market is over or is it just starting?
Few thoughts on major earnings this week like ZM, COST & NVDA
Here’s a link to my last weekly plan where I was a S&P500 🐻 4100, $TSLA 🐻 770 and $TWTR 🐻 41..
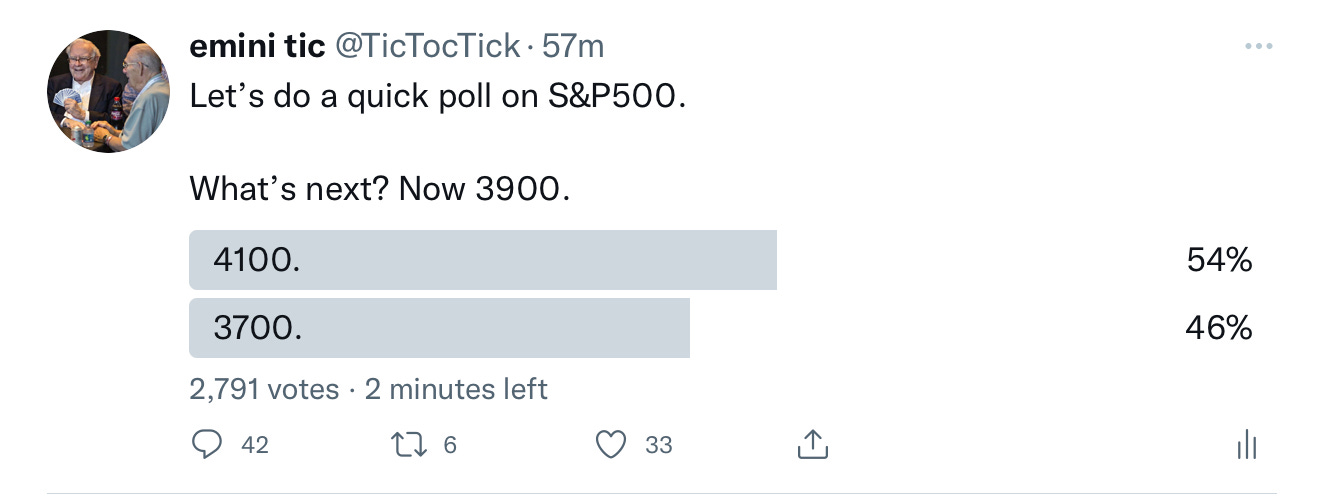
Sentiment check on S&P500:
Majority of participants believe we are headed higher. Figure A below. This sample size is predominantly my own followers though my read on the talking heads and “experts” is they remain bearish into next week.
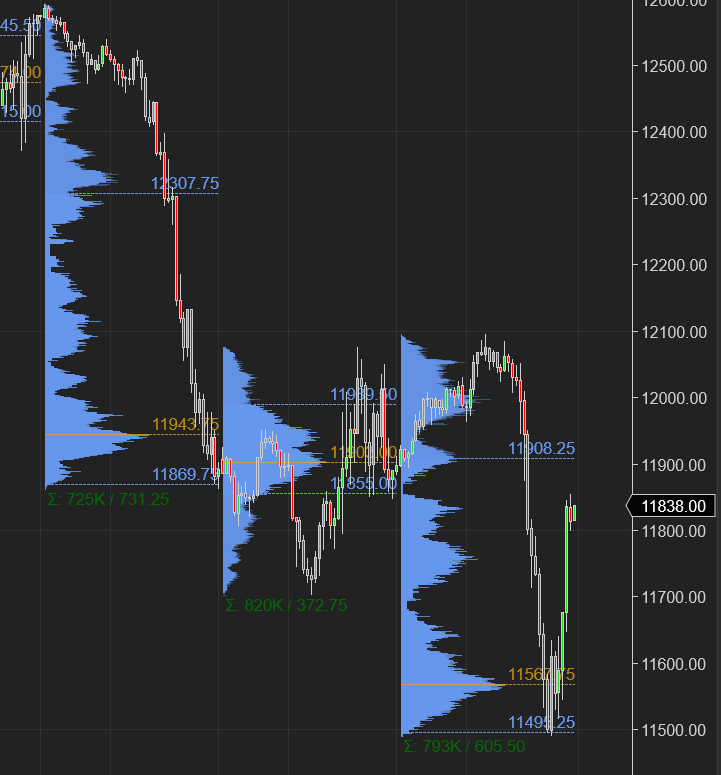
Chart A: NQ Staged an impressive rally however may run into intermediate term resistance at 12000. More on this later.
I want to share a note about my methodology and what this newsletter is (and isn’t)..
Folks, time and again, I do this brief blurb to explain and remind what this newsletter is as I get that some folks believe this is a signal service. This newsletter is not a stock signal service. If you are interested in a stock signal service, there are several on the internet selling their signals for 200-300 dollars or more a month. I have my own opinion on the efficacy of these signal services on the internet but I don’t want to digress. This newsletter is simply sharing my personal thoughts and opinions and educational stuff on a variety of markets. My methodology uses a lots of different inputs to make the calls - these could be fundamentals, looking at key aspects of a business down to its cash flows, it could be option order flows, it is is obviously my own orderflow observation of trades in each of these markets, news flows, sentiment, charts & technicals, and of course global macro. My point is I don’t just use charts or fundamentals but it is a mix of all of them - I do this every week to prepare my self for trading in week ahead. I am happy to share this research and my notes with folks, as long as they are cognizant that this is simply my own personal journal and opinion and it is not a signal service. While I am not a signal service, I have shared a lot of important tools I my self use for active trading. A lot of folks tell me they have been benefitted from these tools and posts. Here is the link to these tools and posts if you are curious to learn more about them: Educational
Speaking of the methodologies, there are a lot of bullish calls on the internet right now which are solely based on one input - FED pivot. Know that FED pivot means nothing in a stagflationary times. Japan and Japanese stock market is an excellent example of this in 1990-2000 after their bubble collapsed. Despite an easing Central Bank, they did not go anywhere for years. If you are interested to read my thoughts on this here is a copy of work I did on how the S&P500 and mega caps may behave during times of stagflation: Inflation vs S&P500
Look, I know that the S&P500 has been lingering here for several days now at 3850/3900. This is indeed where two weeks ago I called a “mini melt up” may start all the way to 420/430 and the BEST we could do was that 4100. This underscores my point about being very tough to call BOTH direction AND timing. Especially short term timing is any one’s guess really. However what is good is if I am patient and have a longer term time horizon, there has barely been any activity below my 3900 “mini melt up”. I do want to qualify this statement with that I think we are in longer term bear market but these bear market rallies can be sufficient to take us to 420/430 where longer term bears may show up again. The good part about my calls is that my 3900 has been respected for most part, in fact at one point rallying all the way up to 4100. Sadly this can not be said for some similar calls by many other folks which were bullish at 4500, at 4600, at 4300 even- we are now 100s of points below those calls for the lows.
No one is thrilled about this inflation and a prospect of a prolonged recession.
Do I think recession is here already? I don’t know, I actually don’t think we are in recession yet- I think we are a couple of quarters away from it. At least.
Now while predicting recessions is not my thing and I don’t think any one else can either, I know one thing with reasonable confidence.
For some one like Investor Tic with a 5-10 year time horizon, where things are hard to predict day to day, leave alone 10 years, what does Investor Tic think? Well he thinks let us say I have 400 bucks lying around in my pocket. I know for a fact that this 400 will be almost 0 in 10 years due to inflation if I let it stay here in my pocket. So to avoid that fate for my 400 dollars, let us say I buy one COST at 400. Now I have bought it, knowing fully well that next year it could be only worth 200. Is this a bad thing?
Not necessarily as far Investor Tic is concerned. And I say that because even though I cannot predict where COST will be in 10 years with certainty, I think it is a fair statement to say it will be 400 or higher. This statement can coexist with the fact that on its way to 400-500 in 10 years, it may stop by at 200 next year. Now if it drops to 200 next year and I have 200 dollars more, I buy another COST bringing my average down to 300. Remember this is the 200 and the 400 that I do not need either today nor 2 years from now to pay for my rent or to feed my son, the Dog.
With a 600 dollar spent on buying 2 COST, I think I now have a fair shot in 10 years for it to be atleast worth 800-1000. Or perhaps more. Now what is the chance that if I let 600 dollars stay in my pocket as FIAT , that it will still be worth 600 in 10 years?
Fat chance. It will be 0.
I share this as one example. But there are many more examples like this. My point is for Investor Tic, there are some opportunities potentially at some of these levels which may make sense when looked at from a 5 year or 10 year horizon. Same thing may make 0 sense when you are looking at it from what is going to happen this year or even the next.
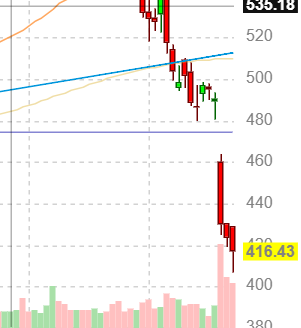
Speaking of Costco, they report earnings on the 26th
Retail has been decimated. Clobbered. Listen a lot of ink has been spent on why COST is the next WMT or the next TGT and is gonna drop like rock, 20-30% on it’s earnings day. It may. But as far as a business Costco is neither like WMT, nor like TGT, and nor like any other retailer in the US IMO. Why?
Unlike Target, Costco does not make money on mark ups. They make most of their profits on membership fees. Their customer is fiercely loyal and I do not know personally any one who is yet to cancel their Costco membership due to inflation.
In fact Costco helps in inflationary times. Buying in bulk always cheaper- inflation or not. Recession? I can think of COST as a safe space during recessions for families and businesses most hit by the recession. In 2008, COST dropped like 25 % compared to an almost 37% for S&P500 in 2008 alone.
They also have a lot of ancillary business units- like the Optical, gas stations, business centers. They run their own meat depots, meat plants, they have a chicken farm in Nebraska, they have units in Mexico, which reduce their reliance on China. From China I think their main imports are electronics and some gardening stuff- not end of the world for them if China were to shut down, unlike an AAPL or TSLA.
On top of that , when they dont make money on mark ups, they own Kirkland Signature which tends to be the cheaper brands in a lot of stuff they sell like baby wipes and alcohol.
Look, you save 15-20 bucks every time you refuel at Costco gas station. You save on produce. Costco margins are like 2% so I doubt they see any compression there any ways. The only red flag I see is the multiple is now down to 31 which is actually lower than it was BEFORE the pandemic, I think may be it drops another 5% after earnings and becomes really attractive for me.
I think where they get hurt is on the fuel and energy side of the ledger. They do take some hit when gas prices hit this high.
I am not saying Costco is 100% not impacted by China, and is inure from inflation 100% and that it will not sell off after the earnings. But I think if it does, prices like 390/400 become very attractive for me. It drops to 360-380? I don’t think it will be a bad trade for investor Tic but do see my note below what I think may happen short term if Costco crashed below 390. But I do think 390 -400 is probably a solid LIS. On Friday, it closed at 415.
Chart below. Costco has been punished along with the likes of WMT and TGT and may be a bit unfairly. It becomes very attractive for me on any dips sub 400. I think the gaps around 480 dollar may be eventually filled but I like COST for long term, set it and forget it.
Here’s the flip side if COST bombed on Friday. Costco is the pulse of American small business and I think if COST crashed on Thursday below 380/390, I think it can cause a large volatility event in S&P500 as well.
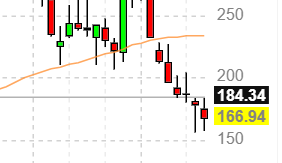
NVDA is another one reporting on the 25th
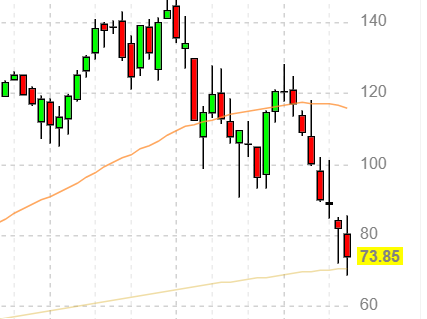
NVDA is down a solid , almost 50% on the YTD. This high flyer is now down a forward PE of 24. Who would have thought this was possible when it was selling at a 100 multiple only last November.
Now I am not saying that the downside on this is over. However, when I put my Investor Tic hat on, I think these prints as they near at 130-140 , start becoming ridiculous if my time horizon was 5-10 years. Based on Friday close I do not think we are there yet but if we get there after earnings, I will definitely be looking to add some for the long term hold into that 130s if we ever get there.
For shorter time frames, I personally think the SOX stocks have been resilient last couple of weeks whether that is a NVDA or an AMD. Looking at AMD earnings, they got a bounce immediately after they report, I think it was like 5%.
My main expectation on NVDA based on Friday close is we may fall into 150-155 post earnings where I may assess if it looks good based on the orderflow there. Based on my analysis , I expect this to remain under 150-170 with some offshoot to 180.
I do think my LIS on this is 179/180, if this pops like AMD did after it's earnings, I think it may be hard to hold 180s and it may drop back into the 150s.
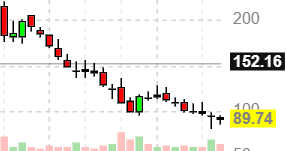
ZM Earnings
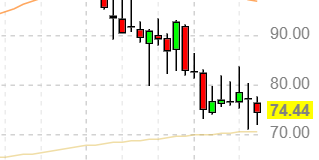
Zoom ZM is no stranger to retail folks. Once a pandemic darling now lays dead. It is trading 89 bucks right now. I think an overwhelming majority of folks are bearish on this going into the earnings on Monday, I wont be so bearish for one and one reason alone- the PUT premiums are gonna cost an arm and and a leg and may not even work. I think 105-110 is a better area for bears to reload and it is a pass for me here as long as bear bets are concerned.
Do you agree or are you a ZM bear here at 90?
What else I am watching
Given the current state of the general market this is yet another week where nothing important has crossed my radar. This should soon change I expect as we start seeing some green shoots in the overall market. With whatever little is out there, here are few names that interest me.
As always the Substack readers are the first to be alerted to any opportunities I see emerge so make sure you are subscribed and get a notification as soon I post a new letter.
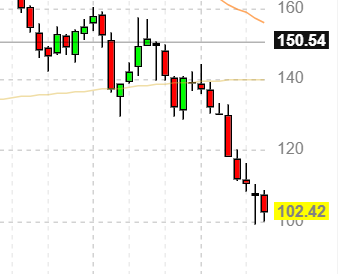
DIS
DIS stock which I became bear at 142 is now down at 100 bucks. I think they have had several issues with the earnings and free cash flows but they are approaching some levels which I am interested in as a long term investor. We are not there yet, but I am keeping an eye out on 80s, the COVID lows. With a little more media driven FUD around this new Monkeypox virus who knows we may get there soon?
Money in MoneyPox?
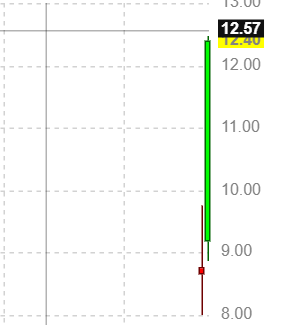
Purely speculative with the Monkeypox mania about to hit thru the roof, I expect SIGA to open big on Monday (15-17?). However if this pullbacks into 10-12 again, I think it may make one more test of its gap up highs. Now 12.
ULTA
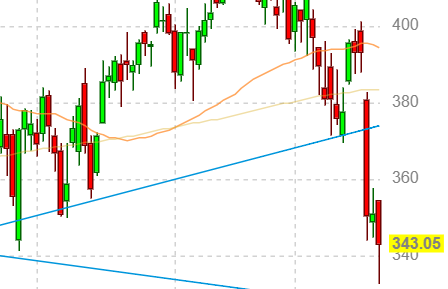
ULTA Beauty reports on the 26th. I think this 370-375 area may prevent it from going higher. I think 298-300 is support on this at this point. Now 343. A lot of these retail type names have a lot of pessimism going in due to what happened to WMT and TGT. I personally think 340 area on this may be a bit unfair to the new bears, may be 375/380 is a better zone for bears . Just my 2 cents.
Home Builders TOL LEN
I am intrigued by these home builder stocks. I know the cost of materials to make the homes in insane, I know the mortgage rates are ripping higher but I also know that they have the pricing power, I also know we just don’t have enough homes in this country.
The charts look little weak but I think the sell is overdone on some of these. Price to sales at almost half for both of them. Unless you expect the mortgage to go to 7-8% shortly, I think some of these home builders are attractive. Let me know if you agree or think these are about to go down even more?
This is a good Segway into my thoughts for the S&P500 Emini next week
Longer term S&P500 has been showing a number of interesting developments to me. Regular readers know I have been expecting 4200/4300 as the upper bound of the new range on S&P500. This has eluded me for a couple of weeks now. The action we are seeing tells me we are searching for the lower bounds of this range and have not found one yet.
If I were to go on a limb, I want to say that that lower end of the range may have been found near that 3800 last week, IF the following happens. Do note the condition quoted by me below.
I think as long as we remain range bound between 3850-3950, there is a risk to the upside at 4100/4200.
This thesis will NOT be broken even if we were to trade the Friday lows ~ 3800 again at some point next week but do not close below 3850. So it comes down to the D1 close below 3850.
S&P500 general market sentiment is extremely negative right now. I can see the reasons being offered by everyone who is bearish- and I kind of agree with all of them for most part. However I also understand that the market is a giant discounting mechanism. Most of the reasons which are being shared online and in media about market demise here are in my opinion (IMO) priced in. With the exception of couple of things a) this war in Europe were to take an unknown nuclear turn b) China were to not open for another quarter or two. Outside of these 2 events, I do think a lot of doom and gloom is baked in the cake at 3800.
Remember I am not saying we are now going back to make new highs any time soon. My forecast is simply in context of a new range forming between 3800 and 4100 (with impulse move into 4200 possible). I do think we are in a bear market right now but I also think in terms of what all bad news may already be priced in already at 3800 and what will be the new impetus to break these lows.
We are now solid 500 points down off the FOMC pump when all said that Powell taking 75 basis points off the table for next 2 FOMC meant the low was in. So price can shift the sentiment very fast and this is why I keep reiterating confirm with the tape rather than follow the news and pundits as their main input is price and price alone does not tell the whole story.
Now, the good part is that technically it will be easy to see next week if this is correct thinking or not. A daily close below 3850 invariably invalidates what I said and perhaps sets us on course to test that 3666-3700.
Next month we also formally start the QT process.
Some folks tweeted at me on Friday that I said if 3850 breaks we could target 3700. This is true. However the context and time frame of my calls must be taken into account as well. My calls can forecast the price levels and direction. Timing wise it is little bit more involved. We not only broke 3850 and traded down into 3800 almost shortly thereafter, we actually fell 120 handles from my 3930 which was shared earlier on Friday’s plan. However at the lows, I sent two tweets warning these lows are unlikely to hold. Look, a lot of these short term option pricing is based on the underlying current and historical volatility. What does this mean? Yes we can have a 250-300 point down day in S&P500 but it is extremely unlikely. So long story short while we may still trade 3700, we don’t get there in a straight line and we certainly don’t get there in a single session. For 0DTE traders, I highly recommend you read up on atleast some greeks when it comes to the option pricing. Short term options can be very delta sensitive. At the bare minimum, I think you need to know what is the IV of your option, is it a certain x percent, and the delta of your option etc. You are flying blind without this input. Just my two cents.
Here are a couple of scenarios and levels I will be watching next week in S&P500:
Friday close was at 3900. I do think there may be initial resistance at 3950 and there may be initial support at 3850.
I can see us trade up to 3950 on Monday and we could find sellers enter the scene there pushing us down to 3850.
If 3850 does not hold, 3800 lows from Friday could be retested.
I think as long as we do not close below 3850 on the D1 time frame, there is a likely chance we are going to break 3950 at some point in the week or the following week, which keeps the narrative alive for a test of 4200. Remember always this is not 0DTE. Confirm with the TRIN/TICK/Tic TOP etc.
A Daily close below 3850 may not be a good sign and could open the door to test of 3700.
I think if we close the week above 3850, ideally above 3950, it gives me a reasonable chance to believe we could have found a new range between 4100/3800 for next few weeks. An impulse move could push us to test 4200.
Updates if any to this plan will be shared on my Twitter. Join it and turn on the notifications.
Longer term, once this 3800 gets taken out, we start eyeing levels like 3666-3700 on the downside which could present formidable support at least for what remains of the year. This however is based on technicals and I do not think I have enough orderflow to even forecast that much down the road. We will see when we get there.
Hope you enjoyed reading the newsletter as much as I enjoyed writing it. Subscribe to it and share the newsletter to reach more traders like yourself.
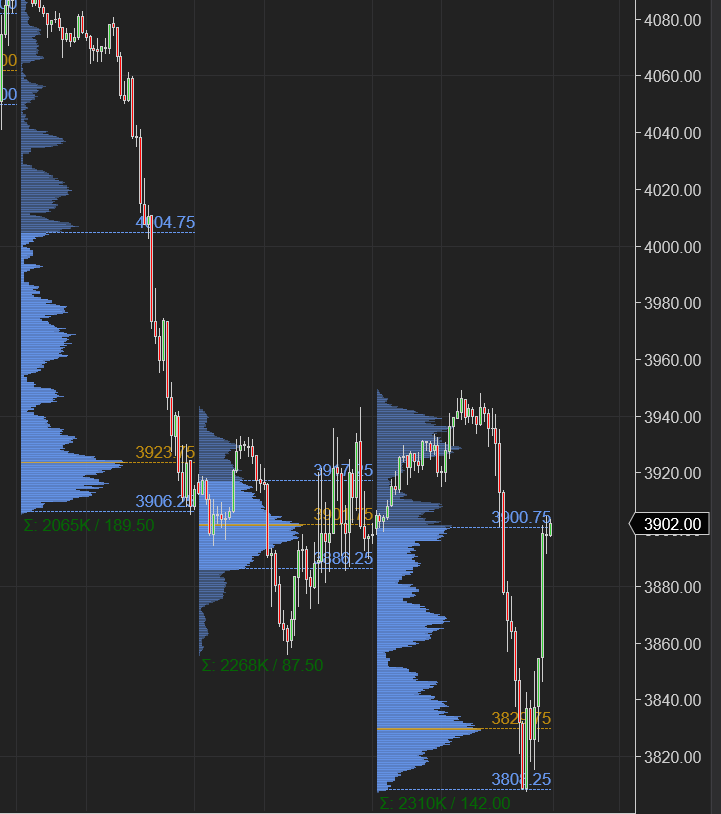
Chart B
Emini chart below. The POC below near 3825 may offer support if this zone is revisited. We can see we need to break above this HVN resistance from prior week above 3925/3950 to trade higher into 4000 IMO.
Recap from prior week
My primary expectation last week was we may find sellers close to 4050/4100 as that may be resistance. This turned out to be the case with we selling off close to that 4100 key level.
I expected 3900 to act as support and a break of it to target 3850. This level also played out during the week. Here is the weekly plan: Previous plan
In my weekly plan, I was bearish on TSLA at 770 which sold off quite heavily this week.
I was also bearish on TWTR at 41 which sold down into 36s this week.
What I did not get was 3700 upon break of that 3850 as shared by me in the weekly plan. However on Friday, I sent two warnings on my Twitter that the lows around 3800 will not hold and that we may close back near 3900 again. Here is the Friday plan: Friday Plan
This is it from me for now. Be careful out there. If there is one takeaway from me it is this - any thing can happen in the market at any time. It is an unstructured place with very little rules or certainties. The only structure we can have is the structure within us in terms of risk management.
~ Tic
Disclaimer: This newsletter is not trading or investment advice, but for general informational purposes only. This newsletter represents my personal opinions which I am sharing publicly as my personal blog. Futures, stocks, bonds trading of any kind involves a lot of risk. No guarantee of any profit whatsoever is made. In fact, you may lose everything you have. So be very careful. I guarantee no profit whatsoever, You assume the entire cost and risk of any trading or investing activities you choose to undertake. You are solely responsible for making your own investment decisions. Owners/authors of this newsletter, its representatives, its principals, its moderators and its members, are NOT registered as securities broker-dealers or investment advisors either with the U.S. Securities and Exchange Commission, CFTC or with any other securities/regulatory authority. Consult with a registered investment advisor, broker-dealer, and/or financial advisor. Reading and using this newsletter or any of my publications, you are agreeing to these terms. Any screenshots used here are the courtesy of Ninja Trader, Think or Swim and/or Jigsaw. I am just an end user with no affiliations with them.


Thank you Tic but those two warnings really gets lost with other gossips when so much is going on during RTH, is it possible that those important tweets are published via telegram until there is a chat room up and running for serious traders like us? sometimes by the time you tweet market is already up 10 to 20 points with no pull back and that really hurts, just wanted to share the practical problems we face during RTH when you do sent warnings out not complaining about it at all because whatever you are doing is awesome but if possible please sent those warnings outside of twitter pleasessss it does helps us a lottttt!!! I really hope chat room is still in plan can’t wait to join ❤️❤️❤️happy Sunday
What is your opinion on Tesla at this level? Is investor tic think is good add at this level?