Traders-
From my plan last week, my key levels were 4200 as resistance and 4060/4070 as support.
Both of these levels were the range of the week and represented the high of the week as well as the low. We rallied at start of the week into 4200. Found sellers. Sold down to 4070 on Friday and then rallied from there to close the week at 4100.
In some other names, I was an ARKK bear at 44 which shed about 10% to close the week near 39.
You can read about the details here in the link below on Chart A and how I explained the weekly auction structure via nodes A thru E and how they represented the weekly range.
Let us look at few things on my radar this week
WEAT
Mostly a breakout of technical consolidation with my LIS right underneath the recent consolidation. I think this level if holds, we could see a 10+ on it.
Ridesharing
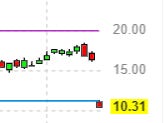
LYFT lost about a third of it’s value in one session last week and is now trading near 10 right now.
Normally when you have these type of moves, there can be aftershocks for a few days to weeks out. However, I think longer term , LYFT appears oversold here near 10.
At these prices, this also becomes attractive for M&A activity.
Rideshare in an important tech component and Lyft with Uber is a duopoly in the US. Not only buying LYFT could provide some one a technical competitive edge against Uber, I also do think there is efficiency that can be gained within LYFT as is and this could be a turnaround story.
LUMN
S&P500 component that is down more than 92% off it’s highs. Visiting almost 40 year lows. Debt saddled. Could go bankrupt.
However, I think also very oversold on longer time frames. Extremely speculative at this point but I think 2.8-3 would be my LIS on this which if visited could offer some support. Now 3 dollars and change.
NOC/LMT
In defense names, I like both NOC and LMT.
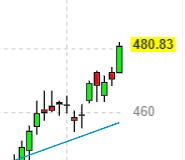
Subscribers know I have been a NOC bull from 430s and it is now trading 460. I think this could go higher and could trade 500+ again.
I like LMT action as well which I think is poised for a breakout and could remain supported on any 460 pullbacks.
Folks - a lot of research and effort goes into these newsletters and if you like the content, feel free to share the newsletter with traders like your self as it helps the channel grow and the message of OrderFlow reach a wider audience.
FTSE/BP
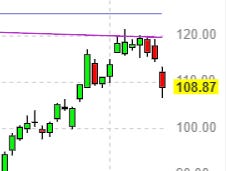
Old , regular readers will recall I had shared British stock BP at 30 before it rallied about 25% this year and is now trading near 40.
I this it may remain supported on pullback and could push higher.
PAG
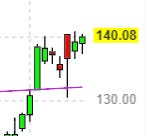
Penske seems quite overbought at 140, but I think if it cooled down a bit it may remain supported for a test of 160s.
Cloudflare NET
I think if this gap near 60 holds for NET, we could see it trade higher above 70. It is now 60 now.
Is there any stock you want my opinion on? Drop a line below and I will consider a name with most asks.
I am also curious to see if folks are bearish or bullish on the general market next week? Take a pause and vote below before proceeding further ;)
With this CPI, things are about to heat up in some of the names that I have been looking at. Subs receive about 10 of my ideas from this week, S&P500 and NQ levels ahead of the CPI + some levels on TSLA and NVDA ahead of NVDA earnings etc. To receive up to 5 such posts every week PLUS real time chat alerts intraday, subscribe below. This is the largest ever discount offered by me for this particular publication. Only valid today!
TSLA
With Tesla I became very bullish on this stock at 100 dollars and change and since then this stock has doubled, almost within one month.
The stock has now since receded about 10% off it’s highs. Longer term readers know my thoughts and levels on this stock, I was one of the first bears at 400, reiterated my bearish bias at 330 and started becoming bullish near 100.
Most recently I shared with subs my level at 195. This is a key level for me. I think as long as we do not close below 190-195, we could remain supported for a retest of 210.
A Daily or a Weekly close above 210 could lead us to retest what is out there at 230 area. It is about 195 right now.
ABNB
ABNB reports on the 14th. I was a bull on ABNB at 100 before it’s recent move to 120. But the stock has since softened.
I will be watching two scenarios -
An ER move that closes above 114-115 could target 120-124 on this name.
I think if it dips into 90-92 area post ER, that level could be support for a move back into 100+.
NVDA
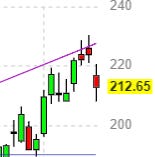
NVDA has suffered a similar fate as TSLA and has since come down a bit. Longer term readers know I had been bullish on this stock at 140 before it rallied to 200.
It is 212 right now and they report on the 22nd of this month.
My LIS on this stock is near 225-230 dollar area. I think if this is visited, it could offer resistance to this stock. Near 225, I personally can not be a bull on this stock on it’s earnings day.
AMD
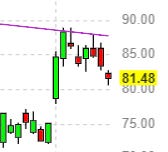
With AMD, I am kind of in the same boat. I do think if this rallies off the back off CPI, I think 90 level in this is quite substantial resistance and we could see a sell off into the 70 area.
It is near 82 bucks right now.
Oil
So it is no secret I have been an energy bull in general and an oil bull in particular for over a year and a half. This has seen some of my calls do well like OXY, XOM, CCJ etc
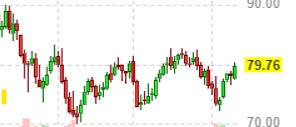
I do think it is possible that we can trade back up to 90 dollars on the oil.
Oil is in a funny spot in my view. I think if oil were to go higher here, then it exerts pressure on the equities as it will depress the growth names.
On the contrary, I think if oil goes lower than 66-70, it could be a harbinger of a massive economic slowdown and could exert pressure on equities. I do think oil will eventually crash below 60 dollars but not before one more leg higher. Ironically this leg higher may well be what brings it down later.
From an event perspective, the main event is the CPI on Tuesday. About a half percent month over month increase in inflation is expected due to higher gasoline and energy costs. YOY CPI is expected to come at 6.2% compared to the last read of 6.5%.
NOTE that this January CPI report is the first one to incorporate changes the Bureau of Labor Statistics (BLS) has implemented in how they calculate the CPI. The main change is how frequently the weighting of each component used in the report is updated.
Before this change was implemented, the weighting was updated every 2 years. This is a far cry from pre-2002 when the weighting used to be updated every 10 years, instead of 2! With this change, the BLS will change these weights every year now. The idea being this will make the reports more accurate and faster to adapt to changing prices in face of major events like Coronavirus Pandemic, wars, supply shocks and so on! This is not to be confused with how often the prices are updated in the CPI - which is every month. This is how often the importance of each item in the CPI is updated- which will be now every year instead of every 2!
At first blush, this change makes sense (kind of). Prior to this change, the BLS will collect surveys from the consumers in years 2019 and 2020 and analyze the consumer spend in 2021 using the weightings from 2019 and 2020 to forecast CPI in 2022 and 2023! This is a 3 year lag from the first time the information is collected in 2019 to the time it is implemented in 2023.
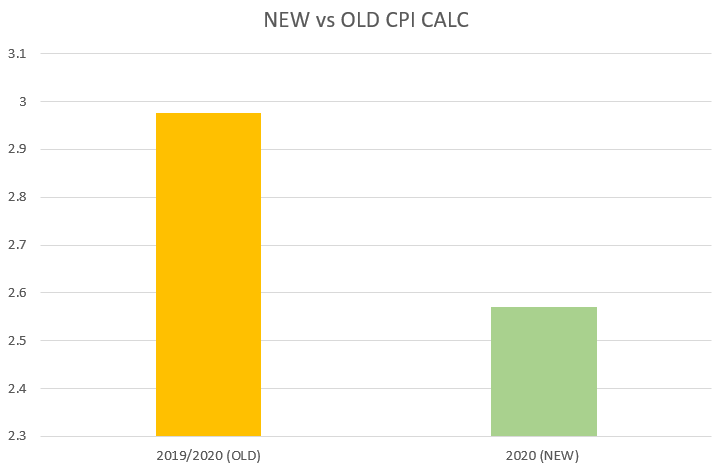
With this change now, the information will be collected from the surveys in 2021, analyzed in 2022 and implemented to forecast the CPI in 2023. This is now a 2 year lag versus 3 prior to this! See below Graph A. I have used the Gasoline category to highlight this change and it’s impact on the CPI.
2020 was a watershed year in terms of changes to consumer behavior and what they were spending their money on. The spend on gasoline dropped drastically due to the pandemic.
Last year, in 2022, the BLS was using the OLD methodology to report on how much gasoline represented as a share of the total consumer spend when calculating the CPI. This ratio was 2.97, shown as the orange bar above in Graph A. This weight was based on data collected in 2019 and 2020! This data had a severe lag and this means that CPI in 2022 in some of the categories like Gas was a little bit inaccurate perhaps skewed to the higher side than it really was.
With the new methodology, set to go into effect this year and to be reported on 14th for the first time, the weights will be based on a year of spend. So the GREEN bar in Graph A above shows the real 2020 spend as a fraction which at 2.57 was far lower than the 2.97 which was a result of data from 2019 (normal spend) and 2020 (abnormal spend).
I do think this new methodology while faster to react to the changes will distort the longer term trends and make the FED more prone to short term mistakes. I think for Tuesday CPI, this means there may be some unexpected large deviations from the expected CPI which is supposed to come in at 6.2% due to this new methodology. It could show rents dropped faster than expected, food prices higher than expected, gasoline could come in hotter than expected as well (as remember this CPI will use the weights now from 2021 instead of 2020 AND 2021! )
A previous version of this blog had mistakenly published CPI being on Thursday. My longer term view on this inflation is that this is going to be a sticky problem and will NOT be resolved as easily as this FED believes. In fact I can see the signs of this inflation uptick across a variety of markers and I believe the FED will be proven wrong to declare a win on this inflation prematurely. However, I am not going to repeat that and you can read the link below for my thoughts on that overall and longer term.
Let us talk about the SPY/SPX action and levels now
It is vital to follow the SPX action and levels from week to week. You will lose the train of thought and the grasp of continuous auction if you are only interested in the market from day to day or week to week.
This is why the regular readers understand the important and they know the key concept of “continuous auction”.
Simply put the market is alive thru the night and in fact night auction is when the S&P500 has made most of it’s gains last 10 years with the day session being mostly chop.
Last week’s levels which were resistance before could become support this week. And vice versa. If you are here only to follow the short term action, you will lose sight of this continuous auction concept and thus lose valuable intel on the market parameters.
So from previous couple of auctions, the market has been focused on 4200 as resistance and 4050 area as support. On the NQ side, the action has been all about control of that 12235 and 12800. This is unlikely to change, until these levels are broken IMO.
Both contracts are March expiry.
I do not see this change UNLESS we begin to see some closes either a) below 4050 or b) above 4200.
While we have sold off quite a bit from 4200 this week, the bears do need to take that 4050 out !
For bears it is quite important to take out that 4050 area. Without that happening, I am not yet seeing a sustained downtrend.
With this said, my key levels this week will be 4050 and 4200.
Scenario 1: We could find support if sold down into 4050 for a retest of 4110-4130.
Scenario 2: 4130 could also be a key level and I think for the bulls if they can attain a Daily (D1) close above 4130, it could target 4200 where longer term sellers may reemerge.
At time of this post, we last traded 4100 on the Emini S&P500.
What is (still) preventing me from going all in into the bullish camp on the Spooz?
I will be quite bullish here at 4100, based on the price action alone, had the related markets acted differently.
So for instance, TLT looks about ready to die here. I called this failed breakout on TLT around 108 and it has been since on a downtrend, trading now near 104.
CL or Oil, see my blurb about oil. Higher the oil goes, more pressure it exerts on every single input that goes into calculating the CPI.
Dollar. I had called for a Dollar bottom near 101/102 and it has been on a steady climb ever since. For the S&P500 to get legs here, we need to see Dollar down below 100. Ideally below 99. I personally do not see that. Not yet.
So to answer the question if I become bullish here longer term, may be 3-4 months out, above 4200, this is what I will need to see:
Gold trade back above 1920-1930.
TLT take back 107-108 handle.
AAPL trade back about 156 which has been a key resistance eon this.
Oil ease back below 76-77 area.
Obviously S&P500 emini trade back above 4200.
Tall order indeed? I think so too.
In particular, when you look at TLT, you would think the bonds should be the biggest beneficiaries of the much forecasted and anticipated FED pivot. But that is just not the case it seems looking at this price action!
There is no reason for this FED to ease off and if it did due to economic downturn, I do not see why the equities will rally so hard? If any thing, I need to see the bonds rally harder and I am just no seeing that yet. At current price action , the deepest and largest market in the world, is not forecasting a FED pivot any time soon.
~ Tic
Disclaimer: This newsletter is not trading or investment advice, but for general informational purposes only. This newsletter represents my personal opinions which I am sharing publicly as my personal blog. Futures, stocks, bonds trading of any kind involves a lot of risk. No guarantee of any profit whatsoever is made. In fact, you may lose everything you have. So be very careful. I guarantee no profit whatsoever, You assume the entire cost and risk of any trading or investing activities you choose to undertake. You are solely responsible for making your own investment decisions. Owners/authors of this newsletter, its representatives, its principals, its moderators and its members, are NOT registered as securities broker-dealers or investment advisors either with the U.S. Securities and Exchange Commission, CFTC or with any other securities/regulatory authority. Consult with a registered investment advisor, broker-dealer, and/or financial advisor. Reading and using this newsletter or any of my publications, you are agreeing to these terms. Any screenshots used here are the courtesy of Ninja Trader, Think or Swim and/or Jigsaw. I am just an end user with no affiliations with them. The data, quotes and information used in this blog is from publicly available sources and could be outdated or outright wrong - I do not guarantee accuracy of this information.





Thanks Tic! Do you see CPI causing a break of either of your support or resistance levels? I know you don’t like formal plans but would be good to know for hedging the portfolio short term for longer terms positions.
Or do we need to wait for tomorrows daily? 😁
Thanks tic! Great insight and good levels on common stocks. I am finding them much valuable on my IRA. On another note, should expect your educational post on spx vs es anytime soon?