Folks -
I am excited to publish part 3 of the volume profile series as OrderFlow education. This blog is my personal opinion and I am trying to explain how I see market structure every day! There is no doubt that 2022 in my memory was one of the hardest years to be active in the markets. The upside if any was that this provided a lot of learning opportunities for most of us. That includes me as well and I am happy to share with folks my own personal learning journey here in this Substack.
The other 2 parts of this may be read here:
Part 1
Part 2
Market profiles or volume profiles are an awesome graphical way to see the structure of the market. The following section assumes the reader has some basic understanding and concept of the profiles. If not, please read the prior two sections.
Before starting my day, here is a checklist of the stuff I want to be aware of:
Are the markets in trend or are they bracketing?
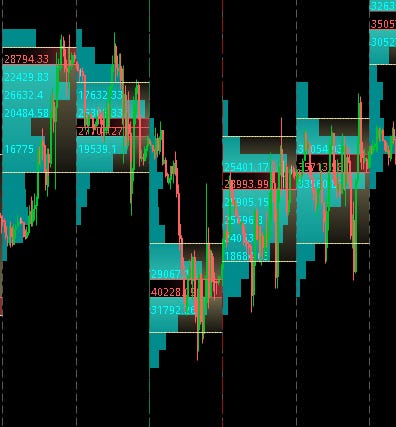
Chart A below is an example of trending market.
Non profile users can articulate this as lower lows and lower highs on their chosen time frame candles.
In technical analysis, we do not care why the market is trending - we only care what the folks may be thinking when the market is trending.
In a trending market, the traders are interested in pullbacks and retracements. One is looking for reference points; a reference point is not perfect but if enough people look at the same thing, it can work! What are some of these references for profile traders?
Value area lows and value area highs
Point of controls
The definition of these is not in scope of this blog. Please check part 1 and part 2 of this series if you are not sure about these.
So in an up-trending market the market may find support at these two levels:
Prior day value area low
Prior day Point of control
In a down-trending market, the following may be resistance:
Prior day Value area high
Prior day Point of control
Now this is not exact science - like all technical analysis, there are dependencies on what is driving the markets- news flows, macro, events.
In my view, profiling along with market internals are formidable combo. I think any one who is active intraday should be aware of these internals.
Here is my work on Market internals- should be read.
If you find this useful, I do ask that you share and allow this blog to reach more traders like your self!
Another key concept is when the trending market trendline gets broken, that means you may have folks who are stuck in their positions - and they may bail out whenever that Value area high (VAH) or the Value area low (VAL ) is revisited which was broken earlier - in this sense, we may see the prior support become resistance and prior resistance then could become support.
This works across different time frames - from intraday to multiple week time frames. The charts used in this have been taken from Think or Swim. The charts are free for Think or Swim users.
Balancing markets
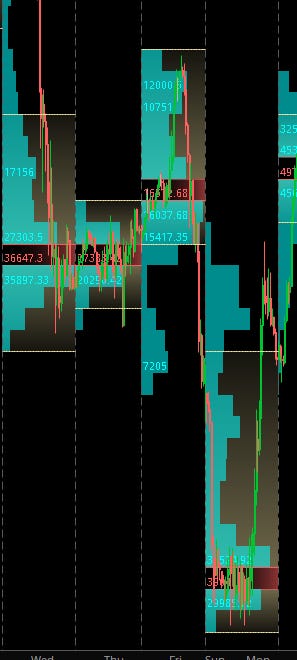
Markets that fail to make a new higher or lower point of control compared to prior session or has a value area that is completely within the body or value area of prior session is a bracketing market for me.
These brackets can form over several sessions and once they are broken could lead to large verticals moves.
The brackets also could be strong resistance and support if revisited.
Chart B shows a bracketing market.
Few other considerations from a balancing market
When a market breaks away from it’s balance and begins forming HVN away from the prior balance, these HVN could be used potentially as support and resistance.
The idea of these HVN is not 100% success rate but rather as areas where there may be lower risk in terms of stop , compared to potential targets.
When a breakout of a balance area fails, it may lead the test of the other end of the bracket.
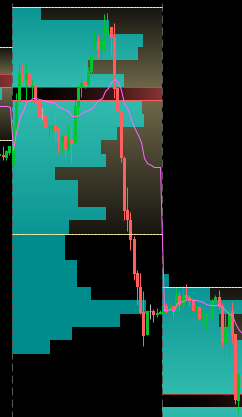
Chart D below. Breakout fails, we fall back in prior balance area and proceed to not only test the other end of the balance area but to break it and go lower.
To get more educational content like this in the new year and stay on top of my new posts they moment they are published, subscribe below. There is still time to get in at lower prices before massive price hikes next year as we fine tune the chat and roll out more features.
Another key thing I watch during the session is VWAP
I am not a big chart user or indicator user but in my view, VWAP is not strictly an indicator. You can read my educational posts below for VWAP definition and construction but simply put, a lot of traders watch the VWAP during the session and it becomes a self fulling prophecy as a result.
Few things I will watch at the open:
Is the close above or below VWAP. How far out from VWAP it is?
Is the overnight VWAP tested in cash session or not ? If so , do we close above or below it to do we reject it?
I do not like to fade strong trending markets below or above the VWAP and in such cases the VWAP could act as initial support or resistance.
To summarize: the market profile and the VWAP along with the market internals represent the macro structure of the market. They can help us identify lower risk and higher reward opportunities when used in context of other factors driving the markets, including related markets.
This post builds on part 1 and part of 2 of volume profile work. Next installment will cover some day types with live examples as the day develops for the subscribers. Stay tuned.
Recap of last week
Click here for a link to my plan from last week.
My main expectation from last week was that we will see the market finding support at 3800 and that the PCE number will be lower than expected.
See below.
This is indeed how it went down as we found bidders come in at 3800 level for an almost 100 point rally.
We also see the market cap at upper end of the weekly range I shared last week with the subscribers here.
Some other names that did well
I had expected WMT to be supported and HD to find headwinds at around 330. This was a good call as Home Depot sold off quite a bit to trade about 20 handles lower WMT rallied.
NVDA
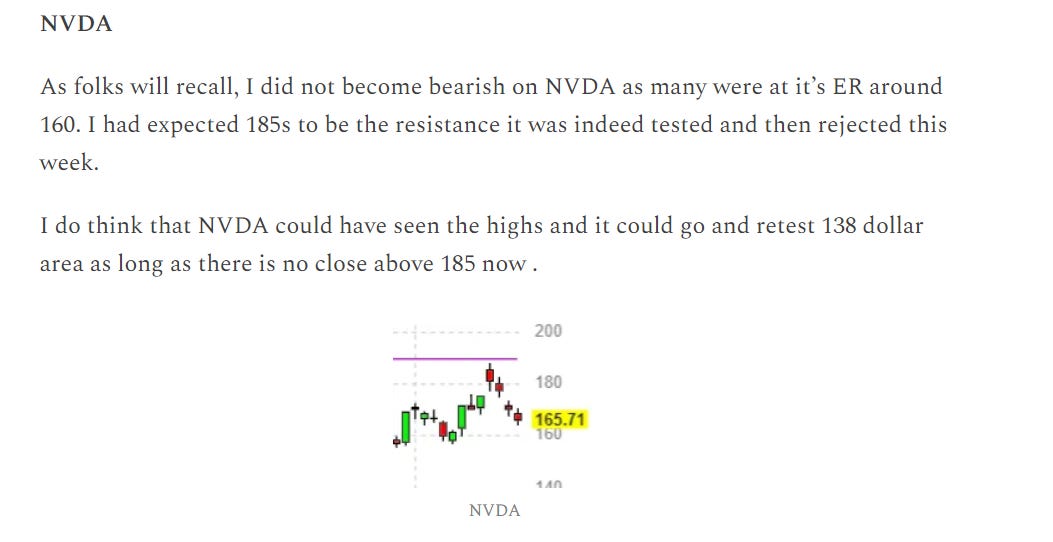
I was also bearish on SOX and NVDA in particular and we saw good selling in NVDA.
TSLA
I was a bear on TSLA at start of the week and we saw good selling in TSLA.
All these levels and biases were shared with folks here in this substack real time.
My levels for this week
This is not a very event risk heavy week with several banks closed on Monday as well as Tuesday. I expect the volumes to be extremely subdued with large accounts away from their desk, not trading full size.
My key level this week will be 3800.
Scenario 1: I think unless there is a Daily close below 3800, this level could provide support and we could push into 3950.
Scenario 2: A daily close above 3950 could target 4050. We last traded around 3868 at time of this post.
If we get a close below 3800, I will share my targets in the chart room below. These are all weekly levels. Any daily and intraday updates will also be shared in the chat room below.
Seasonally this tends to be a strong week. To need to see more headway to the downside I think we will need a close below 3800 else we could remain supported here for a bit.
Little bit longer term, this whole 3750-3800 area is a key area for the bears to take out to the downside. If they can not, I do think we can float up to 4050 early next year.
Some other things I am watching
On longer times frames, there is really not a whole lot interesting going on except a few names which I have shared months ago in this very Substack.
One of those names is ADM.
I do see ADM could remain supported on pullbacks into 90 or so to eventually target 110 and beyond.
ERJ
BA had a good run last year and finished the year relatively strong (who would have thought!) on back of obsolescence.
ERJ I think is close to attractive levels here around 8-10 dollars. I personally think that ERJ has a lot of pent up market in developing countries like India and could soon expand their footprint their. The downside for ERJ is that they have massive debt load and that is one thing I do not like about it. This is why I think a 8-10 area is a better level for it than here at 11. Something to park for now in my watchlists.
Crude oil
Crude oil (WTI) as mentioned by me earlier continues to find support at key 70 dollar OrderFlow level and is now up almost 1000 pips at time of this blog to trade near 80 bucks to the barrel.
Energy markets are incredibly multi threaded and complex and where they go in 2023 will depend a lot on geopolitics . This is true in every single year but it is perhaps even more true next year.
The lowest scenario I have for WTI oil is the war ends in Europe and we trade down below 60-65 dollars to the barrel. This is also most unlikely .
The most likely outcome I think is the war will drag on , the Western governments will continue to put an end to Russian ability to bring oil to the market, the OPEC is likely to capitalize on this. I expect the Oil prices (WTI) to retest 90-100 dollar in this case thru first half of the year to slowly ease back below 70 due to a US recession.
A note about TSLA
Tesla is down in the year . It is down a lot. I have myself been a Tesla bear from 330-400 level and last week my longer term targets were met around 138-140.
This did not stop this stock to sink further to a low of around 122.
This stock started the year with a market cap in excess of 1000 billion dollars and is now down to around 390 billion. A tremendous destruction of wealth .
You can’t help but ask the question is this cheap now at 120?
To answer this question for me personally -
As a technology company , I think it’s quite decent price at the moment.
As a car company, it’s still quite expensive when you compare to the peers.
I do think Tesla is more of a tech company than a car company . However, it’s main product and source of revenue right now is the car. While earlier the critique about Tesla was that it did not have enough supply capacity , now with several giga factories, the focus has shifted to slower demand.
I personally think TSLA is approaching decent levels. However, it may languish for a bit and may not be inured from further downside. It is down about 70% from it’s highs. What is it drops 80% from it’s prior highs? That is only 10 % of a drop off it’s highs but keep in mind, from these levels here, that could be another 30-35% shaved off.
However my view is not for next one week or next month or even a year. It’s multi year time frame .
I think when you look at larger investors and funds , you have to understand they do not go all in at one level.
If they have capital to put to work, they will put some here and there rather than a big bang. This is how the process of accumulation looks like. When you look at 1-2 day time frames , then may be it matters if the low was 122 or was the low 115? Right ?
But if I am looking at this for next 3-5 years , does it really matter if the low was 122 or if the low was 100? I think not . And if I put in a dollar at 120 and another dollar at 100, then I think over time that evens out.
As always I like to share all my assumptions with folks for transparency and my main assumption to make this call is that this will be business as usual with China / Tesla biggest market!
I am assuming China won’t invade Taiwan and the U.S. will NOT sanction China and make Tesla business impossible in China. So there is that!
To summarize: I think the market is mispricing TSLA a lot when you look at it still valuing AAPL at 2 trillion plus market cap. TSLA is selling at same PE of the likes of MCD ! One is the biggest tech innovator, the other is bad tasting drive thru food. However, with potential recession looming, with still months of QT and rate hikes to go, the TSLA stock may still find more downside. I did not like the way it handled at 140 and that may mean 140-145 could be resistance on this stock for a while. Most importantly, the TSLA insiders are in no hurry to buy. The CEO has sold a record 40 billion in stock. In my memory I have seen nothing like that.
However, with a long enough timeline and patience, I think we are near meaningful levels personally.
On the rates side
I made a call back in September-October that the US rates and dollar have peaked as well as I called for a bottom in bonds using TLT as a proxy around 92 dollar level before it rallied hard into approximately 110 area.
The FED came in super hawkish in recent FOMC and other conferences which drove the bonds down again and now TLT is trading near 102.
The FED has reiterated they will remain hawkish for rest of the 2023 as well as into 2024.
This is at odds with the market pricing in rate cuts next year while the FED insisted they will actually really start cutting in 2024 by about 100 BPS.
I think there are credible reasons to believe that the FED will start cutting rates next year .
This is possible if the housing markets continue their downtrend . In many areas, especially in the North and East, the housing inventories have risen a lot and prices have fallen by 20% or more , the price deflation in some housing markets is worst than 2008 Great Financial meltdown. This trend will continue in some markets and next year could catch on to most US.
This will be most likely followed by an uptick in unemployment in early next year .
Once we begin to see unemployment rise in spring next year , I think we will see a softening in wage inflation which has been sticky from over a year now.
This gives credence to my view that the rates have peaked and the bonds could remain supported.
Given the unique nature of where we are in the cycle I think the bonds could do better than the stocks going into next year or so.
This will be amplified if we begin seeing recession take hold of in the US next year with inflation still relatively high that puts pressure in the FED to begin rolling back the rates.
Due to these reasons, I think the yields have peaked and this may provide some tailwinds to the bonds which may not be available to the stocks next year. This includes treasury ETF as well as local muni bonds.
Obviously a lot of this thesis is based on current macro conditions as well as the projection where we will be next year . These projections are built using the current baseline .
What can upend this baseline ?
Well a key part of my thesis is based on the gradual slowdown in economy and inflation as well as the Ukraine Russia conflict dragging on for next year or so .
My assumptions will be voided if we see this conflict either end early or escalate further as both scenarios could lead to repricing across many assets.
Dollar
I called a top in the dollar around 114 here in this substack a couple of months ago and I stand by that call but I think calls for a demise of dollar (below 100) are very premature .
Notwithstanding what’s going on with USDJPY, I think the dollar will remain range bound for several months to come - I do think EURUSD will soon begin a downtrend to trade sub parity again, it’s at 1.06 right now . I also think GBPUSD remains very high relatively at 1.21 and needs to come down quite a bit .
This is it from me for now! Feel free to share and subscribe this newsletter with traders like your self!
On the pricing side, the prices are going up in the new year due to the chat room and more content like options flows intraday to be shared in the new year, however this is a good opportunity to get in at perhaps the lowest prices in long long time to come. Price hikes will not affect existing subscribers.
~ Tic
Disclaimer: This newsletter is not trading or investment advice, but for general informational purposes only. This newsletter represents my personal opinions which I am sharing publicly as my personal blog. Futures, stocks, bonds trading of any kind involves a lot of risk. No guarantee of any profit whatsoever is made. In fact, you may lose everything you have. So be very careful. I guarantee no profit whatsoever, You assume the entire cost and risk of any trading or investing activities you choose to undertake. You are solely responsible for making your own investment decisions. Owners/authors of this newsletter, its representatives, its principals, its moderators and its members, are NOT registered as securities broker-dealers or investment advisors either with the U.S. Securities and Exchange Commission, CFTC or with any other securities/regulatory authority. Consult with a registered investment advisor, broker-dealer, and/or financial advisor. Reading and using this newsletter or any of my publications, you are agreeing to these terms. Any screenshots used here are the courtesy of Ninja Trader, Think or Swim and/or Jigsaw. I am just an end user with no affiliations with them.


Tic, from the VWAP section where you talk about what you look for in the morning, “Is the close above or below VWAP. How far out from VWAP it is?” -- is the close you are referring to the IB close?
I noticed not a single word about gold, silver or precious metals at all. Was that purposely done or just no clear outlook that you currently want to share?