Traders-
Hope every one had a great weekend and is all charged up for another good week, highlight of which may be the FOMC and the rate decision on Wednesday!
I have been presented with a dichotomy when it comes to having a bias for this coming week due to a few obvious and a few not so obvious factors:
To start with, I do not have any doubt that the FED being the indecisive and a passive players, will stick to the 75 basis rate hike and will not rock the boat too hard. I think any one expecting a 100 BPS will be disappointed.
Then personally there is the question of TSLA for me. While I called the key TSLA levels this week on both downside and the upside, I am the first one to say I am right now very perplexed by the action in Tesla stock.
I will cover both these in more detail in the sections below but I want to kick off this weekly newsletter with this background as it will influence how I view the market this coming week.
A quick recap of the week that was
My BEST call this week was my prediction about pre CPI positioning.
See below from last week.
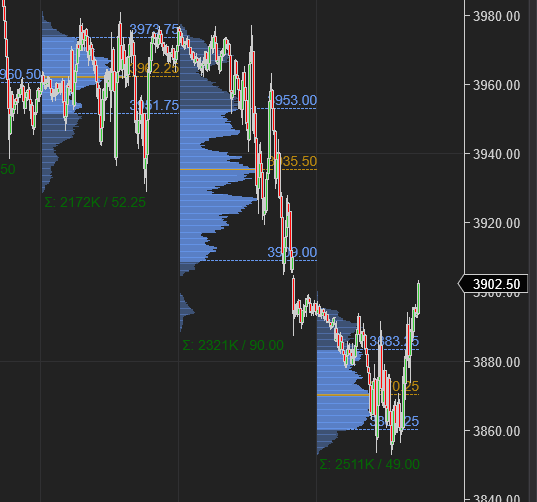
I was 100% correct on this and in fact my 4150 level from Tuesday trade plan was the high of the week before we crashed down below 3900, almost into 3850.
My 2nd best call I think was TSLA this week.
I had shared 290 as support on this stock and 310 as the resistance on the stock. We jumped from 290 into 310 and found sellers at 310 to find our way back below 300.
As far as my analysis of these markets go, I put in a lot of thought energy into these levels and I do not take any of this for granted. There are things which look obvious at first blush but once you go deeper, you being to peel additional layers of complexity beyond what is just obvious.
I was also quite pleased with my bearish calls on HD and ADBE
ADBE in particular I have been a long term bear but I reiterated my bearish bias at 400. Lo and behold the stock shed 25% of its value within a week! Tremendous bearish action in Adobe.
While I do not rule out further downside in ADBE to test that 250, personally for me at 290-295 this stock is where I do not mind buying a few shares here and add more later. This is not a trading time frame decision but from an Investor Tic perspective, it is not bad price here, when he is looking at the stock from a 3+ year time frame.
Just remember this stock was about 700 last year!
Another shoe that dropped last week was FDX which I have been quite bearish many months now
In fact I had shared in this very weekly newsletter with the folks that how a FDX close below 230 was not only a negative for FDX but also for the whole market. This was around 4250/4300 in S&P500.
Yet here we are having lost more than a third of value in FDX and about 500 points lower in the S&P500. Tremendous bearish momentum.
I find it rather humorous that the FDX CEO, who sees on his desk every day reports about global shipping volume and quantitative measures of global shipping is seeing a global recession yet we have the FinTwit gurus exhorting the value in these markets and pressing on with their melt up calls because they “feel” a FED pivot.
As I have been saying for a while now, whether the FED pivot happens or not, which I think it will happen, the damage has been done already and will be exacerbated in next 2 months with FED rates now about 4%. The system can not handle this. Remember the FED rate only a year ago was almost 0. This is a huge shock to a system laden to the teeth with debt.
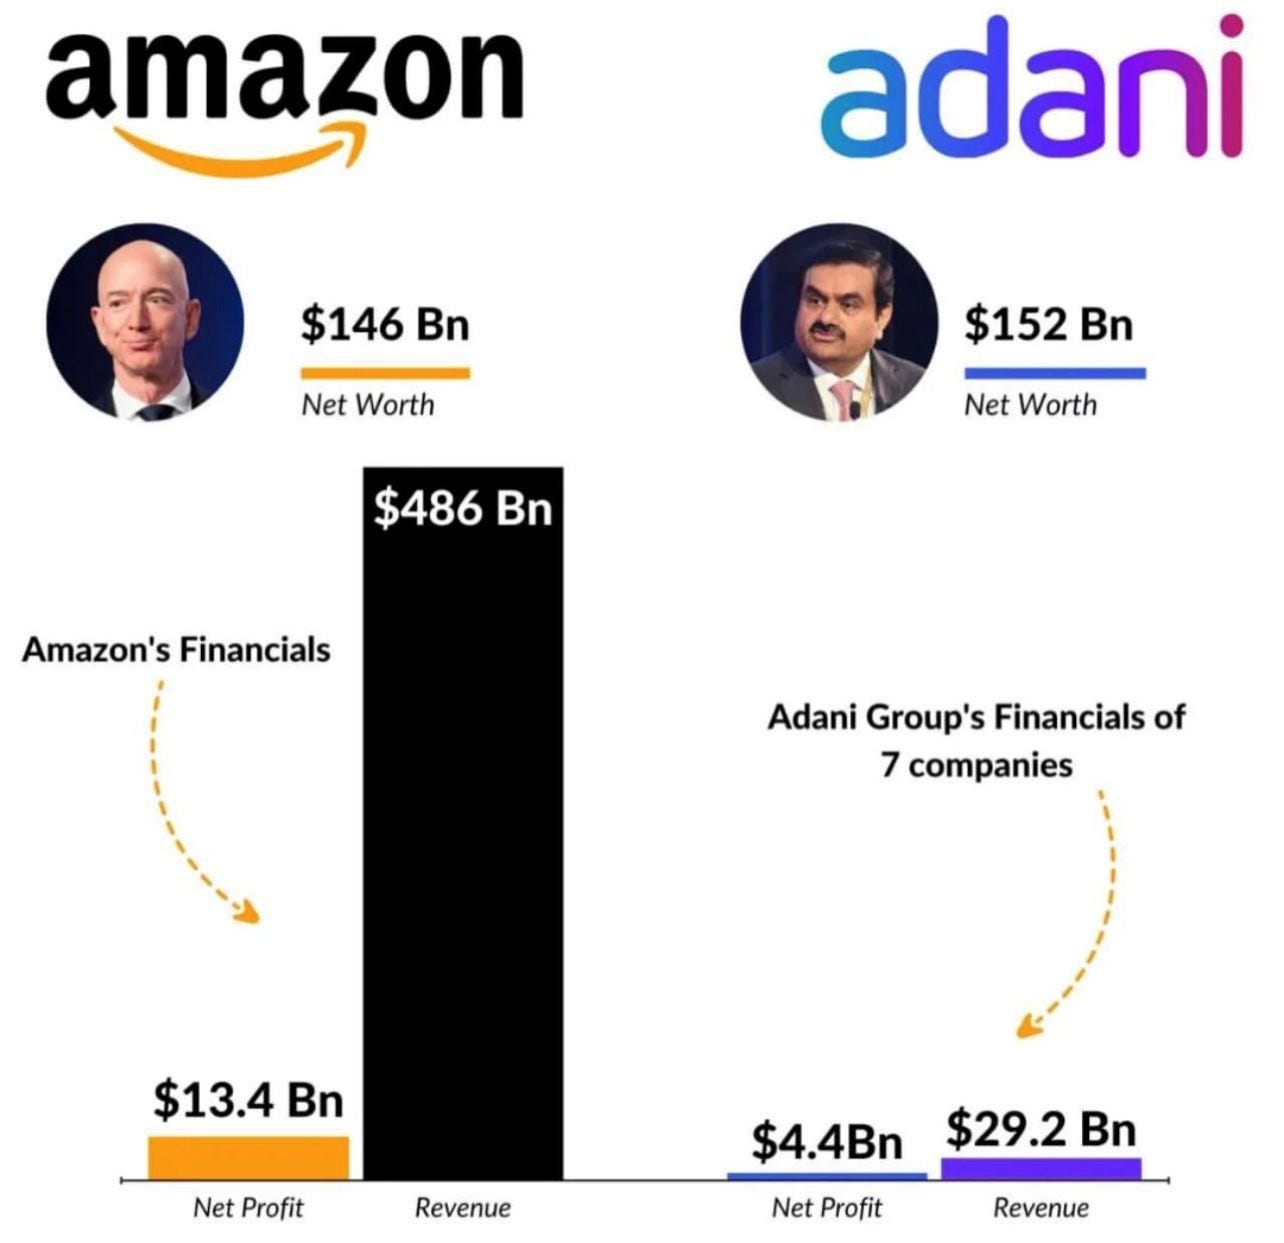
In a rather interesting turn of events, we saw net worth of Gautam Adani, an Indian businessman and a billionaire take over that of Jeff Bezos. See image A below.
While I do not pay much attention to these billionaire ranks as they are subject to the vagaries of market action, I found this one to be an extreme case and the image above illustrates my point.
This proves my point there is still a lot of slush liquidity in the system and is flowing to any where it can and in this case it is flowing to companies with very little revenue and very high multiples like in excess of 600-700.
This in my view is the problem and we will not see a meaningful, long term bottom until we saw this liquidity drained away.
The Central Bankers globally could not be clearer - they are reiterating almost every week they will hike faster and longer, they will withdraw liquidity far more dramatically than earlier expected. However, for now, no one seems to take them seriously. We will see how this ends up in a year or so.
Back home, this may be playing out with the shares of AAPL and TSLA. Only time will tell.
My call on Gold did not work as expected.
The CPI news then took the air out of Gold and it crashed below 1700 into almost 1650 where as I had expected it to remain strong above 1700 and trade 1750.
While the metal itself crashed, the miners like NEM who I have been bullish on from 38/40, did well to close near 44.
In fact if you look at some of the metal charts like the Silver, the charts do look quite robust.
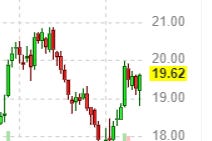
Chart A Silver below.
Silver ETF SLV now about 18.
I think the market is calculating that the Dollar will remain strong and this is causing a pressure on Gold and Silver. In my opinion, Dollar will not remain strong and therefore I think personally the Gold and Silver metal are cheap. In fact I think the miners like NEM are also historically cheap. Again- this is not a day to day call but vey much in realm of Investor Tic , looking ahead at 3 + years. Even more.
My take on TSLA action
So while TSLA remained range bound between my 290 and 310 this week, the action in it has been confusing me about it’s impact on the SPX, SPY and I want to get this out of the way before I proceed to talk about the S&P500 levels and my primary bias this week.
So, longer term readers know that TSLA is one of my favorite tech stocks and I was the one to predict several months ago that TSLA stock will overtake the other mega caps. This indeed turn out to be the case. However, I also think this is the stock that will be the last shoe to drop before we find a meaningful bottom as I think right now at these prices, it is very speculative and is a PLTR on steroids.
I have been waiting for this stock to trade sub 200 before I begin to add to TSLA and it has eluded me. Why?
While there are no definite answers in market analysis, I think it has got to do with a few things actually:
Obviously, the stock has had wild growth and that is helping it from fundamental side.
Then there is a question of short float which has been high on this for a mega cap. That is also fueling some of the moves.
But I think the biggest factor is that the market senses the energy prices are not coming down and it is calculating that there will be more stimulus from the Biden admin to help folks buy an EV.
For instance, next year there is a 7500 EV credit for any one making less than 150, 000 dollars on a new car and 4000 on a used one - only for EV.
There are untold rebates and discounts on any one getting a new solar roof etc
Of-course this all depends on 2 key factors A) energy prices remaining high B) unemployment remaining low.
However, if both A and B remain high and low respectively, I think then CPI also remains high. That means FED funds rate remains high and that means A may remain high but B can not remain low!
So this is very complicated calculation and I personally think the market is wrong in assuming this benefits TSLA in the short term but it may help it in the long term.
I am going to use this context to make a call on TSLA stock this week but know that this is a low confidence call, sharing FWIW.
I think I will not be surprised if TSLA makes a run for 310-313 again this week and will not be surprised if we close above 310 on a D1 time frame.
The part I am not very sure is if this breakout will hold on the W1 time frame. I think the breakout may fail on the Weekly time frame and this could void my context shared in subsequent sections below.
At time of this post, we last traded around 303 on TSLA.
What are your thoughts on TSLA ? Drop me a line below and let me know.
This was a FREE preview of my Weekly Plan. In following sections I share an important update in context of FOMC and recent bearish tape on top stocks. If you care to read about 5 such posts every week with my levels, all of which are based on Level 2 Depth of Market analysis, then subscribe below while it is still very cheap to subscribe.
Outside of these levels, for me there are no absolute right and wrongs. I do not claim that my levels will work 100%. Once the market trades above my LIS (Line in Sand) and I am bearish, I know I am wrong and I cut the loss. When I am bullish and the market trades below my LIS, I know I am wrong and I cut the loss. There is nothing more to it than that for me personally.
My levels for emini S&P500 this week
Technically, this week is a little hard for me to make sense of due to A) as I said the action in TSLA and B) various sort of technical breakdowns in many stocks like GOOG for instance.
My primary technical thesis is while GOOG and AAPL broke key levels, I did not like the auction at the lows.
Combine this with the fact that you have 75 BPS widely priced in and an admin which is still splurging on populist programs informs me that there is still a lot of slush liquidity floating around which needs a home to go for the holidays.
In markets, obviously there are no certainties or guarantees of what I am saying, however, the levels can give me a pretty good idea if I am right or wrong in my thinking.
With this said, my key levels this week will be 3940/3950 and 3750. We closed at 3900 on Friday.
Scenario 1: Unless there is a Weekly close below 3720/3750, this price if tested may see us bounce for a retest of 3940.
Scenario 2: A weekly close above 3950 may target a retest of recent orderflow level at 4170.
In general, at this point I am thinking further softening below 3750 may be hard to achieve and we may retest 4170 OrderFlow level. This is void if we close on a weekly time frame level below 3720. Read more context about Tic TOP below why I think so.
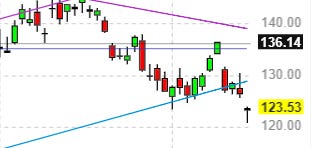
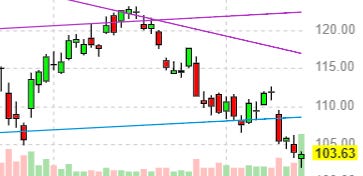
My thinking is also that if we close above 3950 this week, it may lead to a test of 4170. This scenario will need/require A) GOOG close above 105 B) TSLA close above 310 and C) NVDA close above 140. Now 103, 303 and 130 respectively.
If indeed my Scenario 2 comes to fruition this week, the next leg of selling may come later after the holidays. This week is a proof of concept week for me due to the factors described above and I believe a lot more clarity will come to me (and the markets) after this weekly close.
These are weekly scenarios with their scope 5-10 days out. Look out for the Daily Plans with Intraday time frame updates.
What else I am watching
I think the bearish case and the bearish sentiment is quite widespread out there and if the tape weakens after Wednesday, there will NOT be a dearth of plays on the downside.
What I have my eyes on is on that close above 3950 or the action near 3750, if we manage to get there.
I think the Tic TOP stocks which are MSFT, AMZN, GOOG, AAPL and TSLA along with NVDA/AMD may be winners if Emini S&P500 were to close above 3950 on the week.
At this point, we have the below action in these:
MSFT trading now near 240
AMZN trading now near 120
GOOG now near 100
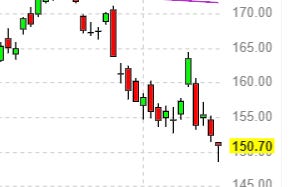
AAPL now near 150
We have already talked at length about TSLA near 300.
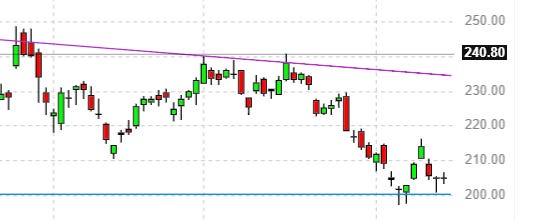
If you were to get a key theme out of these stocks, with the exception of TSLA, is it one thing: they have all broken down below key trends and levels.
While normally this will be very bearish, the action last week did not convince me that these breaks will hold and we may bounce for the intermediate to short term. Main reason for this belief is that I was not convinced that the OrderFlow on Friday in these stocks was bearish- this may or may not be true and could be influenced by the Monthly OPEX flows which may have thrown me off. I like to share my reasoning behind every thesis and this is no different.
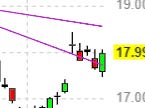
If I am right, we will soon see these stocks take back their break down levels (shown in charts above).
If this indeed happens, I will not be surprised if we see a 10-15% rally in some of these names before the downtrend begins.
This means S&P500 Emini could go back to retest that 4170-4200 again (as long as we do not see a Weekly close below 3720).
Keep in mind while this is my thinking, there is no confirmation YET FOR ME. This is a FOMC week so it may mean a lot more chop before direction is revealed.
In general I will be hesitant to be a bear if we close above 3950 and hesitant to be a bear close to that 3750 if it trades unless we were to close below it. This does not change my 1 year outlook on S&P500 but this call is in context of swing time frames.
To summarize: a key breakdown on leading stocks is normally bearish. The auction on Friday cast doubts in my mind these breakdowns will hold. If I am right , we may see these stocks take back some of these key levels. In particular I will watch NVDA at 140, GOOG at 105 and TSLA at 310. TSLA weekly close above 310 and SPY close above 395 could be a good intermediate term bullish signal.
Let me know if there are any questions.
ENPH was also a very good call by me shared here in this newsletter where I gave 300 as support and it was indeed a great level.
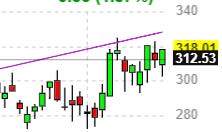
It is now 318 and it looks it wants to break out higher into 350 area. As long as the general market does not stink.
My goal is not to conform and hash out the same content every-one else is hashing out but actually share levels that work. My secondary goal is never to predict but be prepared. This newsletter is my personal journal which helps me prepare and set the context for the upcoming week. I am happy to share this with the folks.
If you enjoy my work, then consider sharing the letter and gifting a copy to the folks you may think could benefit from this.
~ Tic TOC
Disclaimer: This newsletter is not trading or investment advice, but for general informational purposes only. This newsletter represents my personal opinions which I am sharing publicly as my personal blog. Futures, stocks, bonds trading of any kind involves a lot of risk. No guarantee of any profit whatsoever is made. In fact, you may lose everything you have. So be very careful. I guarantee no profit whatsoever, You assume the entire cost and risk of any trading or investing activities you choose to undertake. You are solely responsible for making your own investment decisions. Owners/authors of this newsletter, its representatives, its principals, its moderators and its members, are NOT registered as securities broker-dealers or investment advisors either with the U.S. Securities and Exchange Commission, CFTC or with any other securities/regulatory authority. Consult with a registered investment advisor, broker-dealer, and/or financial advisor. Reading and using this newsletter or any of my publications, you are agreeing to these terms. Any screenshots used here are the courtesy of Ninja Trader, Think or Swim and/or Jigsaw. I am just an end user with no affiliations with them.



$TSLA is the alpha and omega of this market since 2019 and, as you said, the real bottom in markets will require $TSLA shareholders to capitulate.
I note that, for the first time in 3 years, the 200 daily SMA is flat. This is not how I trade but it is something many take notice of.
Therefore, while $320-325 is a possibility, I don't see $TSLA holding the whole market up, irrespective of its fundamentals.
$160-180 is what I am looking for buys and I will happily short above $320
My 2 cents as you invited our thoughts
Historically markets always make their big moves after OPT X. Generally not enough volume can come in to override all the open contracts the week of OPTX. Markets are about to issue an FU move before the meeting possibily trading near 4000 through Wednesday. Just to have everyone scratch their heads just enough to turn people bullish. Turn will happen by end of week with huge volatilty expansion. Expecting to see 3400-3500 by 10-7 with $TSLA shedding a massive amount of points. Why cant $TSLA hit $315 this week and close the month around $225?