Traders,
I am back at my desk from a busy travel schedule and in this weekly post, I want to touch upon some very important points.
One such thing is I want to address how I avoid my own bias in my intraday trading.
It is not secret I am a S&P500 bear, I have been bearish on the S&P500 from January 3 2022 at 4803 and I remain a longer term bear on S&P500.
However, I also trade intraday very actively and I want to share how I avoid my own bias in intraday trading where I can be both bearish and bullish, often in the same session. I really hope this adds value to any one else with similar intraday time frames.
My Levels for next week
The volume on Friday I think was one of the lowest volume days in Emini S&P500 over several days. See the next section titled “Wrap up for last week” for more info and charts.
We also saw good action in Crude oil last week where it rallied over 800 ticks from the levels shared by me to 95 resistance and then found sellers to sell down into 92 dollars. See Chart below.
I personally think as long as the bulls defend 88 level, it may offer support for a test of 94/95. Personally I think oil may remain bid here above 88/90 and could try 100 handles again at some point.
We also saw some good action in OXY which I have been bullish on some time now and I expect a test of 70 on this name.
I do think the majority view is bearish on energy - I am personally not there yet. I do personally think oil can still regain that 100 dollar base it lost.
On the S&P500 side, my key levels for this week will be 4196 and 4130.
We closed the Friday auction at 4280 level. I expected the market to remain bid into 4256 if we closed the IB hour close above 4233. The close was 4236. One hour into the session, a TSLA buy program ran which ate up every offer on its way to 900.
On TSLA, I personally think this 900-911 area is key. In past many auctions have failed here and I will be interested in seeing if we can manage a D1 close above this zone here this week. The support I think below comes in at 865-870 zone on the weekly time frames. A D1 close below 865 may target the next weekly time frame support at 840 dollars.
So on the emini side:
My intermediate level will be 4196 this week. For the intermediate level, if this levels holds, my target will be 4233.
A D1 close below 4196 may target the next weekly time frame support at 4130.
On the NQ side, we saw weak volume again this week but we managed to close around 13500.
I think there is intermediate support on NQ at 13150-13200 level which if broken on the D1 time frame could target 12800 below.
Intraday updates to this plan if any, may be shared on my Twitter and Telegram. Eventually, I want to move over to a dedicated chat room for subscribers but until then , we will need to leverage Twitter free feed.
As far as the event risks go, this is a very light week with FOMC minutes out on Wednesday but we will be heading into next week with the Jackson Hole which could cause some volatility.
A quick pulse check on some names I have been bullish on
ENPH
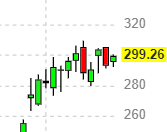
ENPH was shared with folks here in the Substack at 150 and was reiterated bullish by me on its earnings I think around 230. The stock is now trading close to 300 and I think any dips into 275-280 this name may remain support.
OXY
I have been an OXY bull from 40s and have reiterated by bullish bias into this around mid 50, it is now trading around 65.
My target on this is 70 followed by 100 dollars.
ADM
ADM is an old familiar name I had shared in 70s with folks here before it rose to almost a 100 bucks. It has since come off but I think if it holds 83-83 area (now 85), it could make an attempt to take out 92-94 again.
Similar to ENPH, I actually like this PLUG stock as well which has similar thesis behind it.
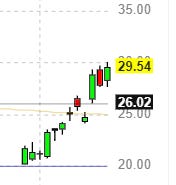
It is now trading around 29 bucks which has been an old resistance. But with my LIS at 27, I think it could have a little more juice in it to test 33-35.
What is LIS? LIS is the level where if we get a daily close below, I have been wrong in my thesis.
In the next session, I share some ideas on how I avoid my personal longer term bias from my intraday trading. I have used these tools and concepts for years and I am happy to share with folks.
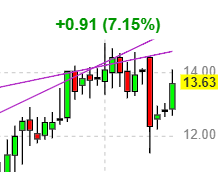
Long term followers know I have been bullish on the healthcare sector from a while now. One such name which is extremely speculative (and volatile) is Target (TH). It has had a good run so far and I think as long at it holds this 10.5-11 handle, and if it manages to break above 14, it may be in for a nice run. It trades about 13 bucks now.
If you like these levels and would like to get up to 5 such posts every week in your inbox, subscribe below.
On the large cap side, I have been a UNH bull from sub-500 and it is now trading close to 540.
I think healthcare has some tailwinds which may mean UNH and other mega health care names remain bid on pullbacks (INTO 526-528).
CI
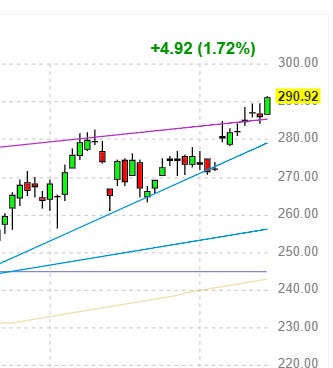
CI as well just like UNH, the daily auction looks pretty robust on it . It is trading around 290 right now with my LIS below at 275-280.
I have shared some educational content below in Section 3 for intraday execution. However, a common question is how do I select my LIS on swings.
Here is a post I shared some thoughts on back when.
Wrap up for last week
Here is a link to my weekly post from last Sunday: Weekly 8/7/22
My primary expectation and level was around 4160 from last week. I expected the market to remain bid to target 4190 as long as the bulls could manage a close above 4160 and expected a test of 4090, followed by 4030 on the downside.


