Traders-
This was a week dominated by inflation data from the US which was good from a risk asset point of view.
Stocks, Oil, Bonds, Gold and some other commodities rallied. Yields fell. The US inflation data took starch out from July interest rate hike scenarios. This caused a decent rally in the bonds and the 10 year yields settled right under 4%.
On one hand easing inflation fears are stoking bets that the rates have more to fall and at the same time, the tightness in labor market is acting as a counter force against the bets that the longer term bond yields will far much below current levels.
The market is now more and more forming consensus that there will not be further rate hikes, this is a call that I made many months ago that there will not be any more rate hikes in the US. However, the yields are also not signaling a collapse in the yields any time soon. My call remains that the rates may remain close to 5% this year and closer to 4% all thru next year with the rates slowly returning to 3% in 2025.
This belief may have credence - when you look at the service sector data coming in hot, with many employees and contractors able to demand, and receive sizable wage increases. Wage pressure I think will remain until we begin to see a crack in the employment rate. Post pandemic, work from home situation had meant a lot of white collar workers were also able to do more than one job, and this has also been adding some pressure to the wage component of the CPI.
From a data point of view, next week is early sterile. The event risk does not fully return until July 26th with the release of the July FOMC statement and rate decision.
On the Dollar side of the house…
Despite the likelihood that we could see 4-5 % interest rates from the FED for next year or so, the Dollar strength story looks weaker by the day.
Notably I had become bearish on Dollar around 1.03 mark and the Dollar beat a hasty retreat from those levels to close right under 100 level this week. US data does not look to support a strong dollar, especially when you couple this with the messaging from the ECB. ECB messaging to me appears subtly hawkish, much more than that of the FED and I think this could keep pressure on for the US dollar.
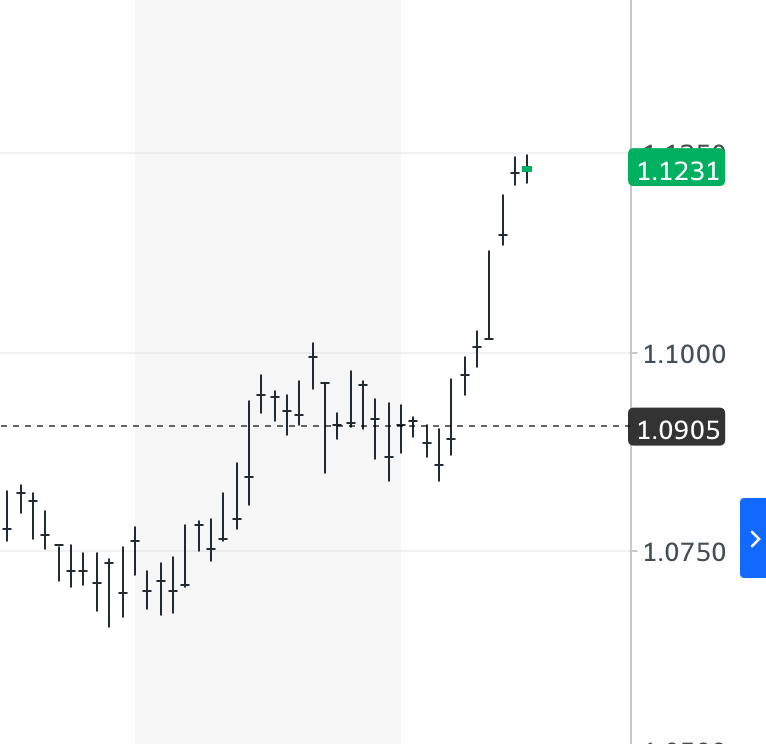
EURUSD Chart above. I think if the EUR were to pull back to 1.1 against the dollar, it may be supported for a move back into 1.15 area. In short term, Euro seems a little bit overbought at 1.12 and could release some steam on a pullback.
Similar themes can be seen in USDJPY for example. Bank of Japan has been extremely dovish, in contrast to other Central Bankers, but still I think minus a very hawkish FED on the 26th, along with a rate hike, USDJPY may run into resistance at 140.
Relatively Japanese Yen is very weak against the Dollar and could drop into 110/120 area as long at 140-143 holds.
Similar dynamics can be seen in the other markets such as Gold.
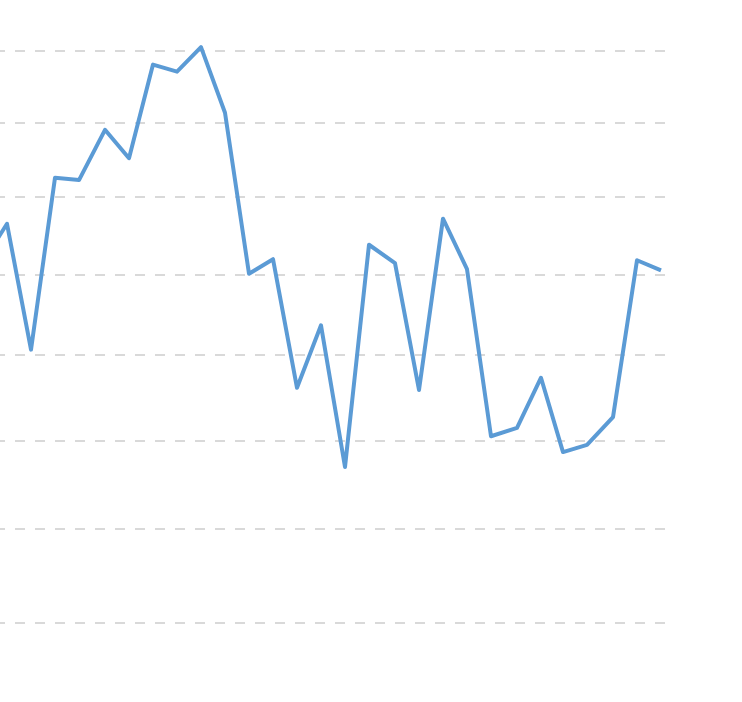
Chart C below. S&P500 measured in Gold. Recent auction below with well defined support and resistance in recent one year timeframe.
Gold itself has been in a bull market in last 20 years, having risen about 500% on shallow pullbacks.
Most recent pullback was into 1900 area which I shared as a support level. Gold has since then rallied from that level to close near 1960 an ounce. I am a Gold bull and I think 2200-2300 is possible on this.
At time of this post, the CME FED Watch tool is indicating about a 90% probability of a rate hike by this FED on the 26th.
I think it will be a bad idea by this FED to hike again as the effects of last 10 or so rate hikes is still to fully seep into the system. However if they do raise the rates again in July, I think this will be absolutely their last rate hike in this cycle.
Now some of the most esoteric names like Bitcoin…
Bitcoin finally rose about 7000 dollars from my LIS near 24-25K which I had shared as a key support. Bitcoin then managed to cool down a little bit from near 32000 and has since closed near 30K.
With the recent inflation data, a lot of bets are being placed or being wound down. Dollar is in important cross roads again and I think we need to be cognizant of the action in Dollar going forward as an important market. I think Bitcoin absolute key levels are now 24K and 32K for the next directional push.
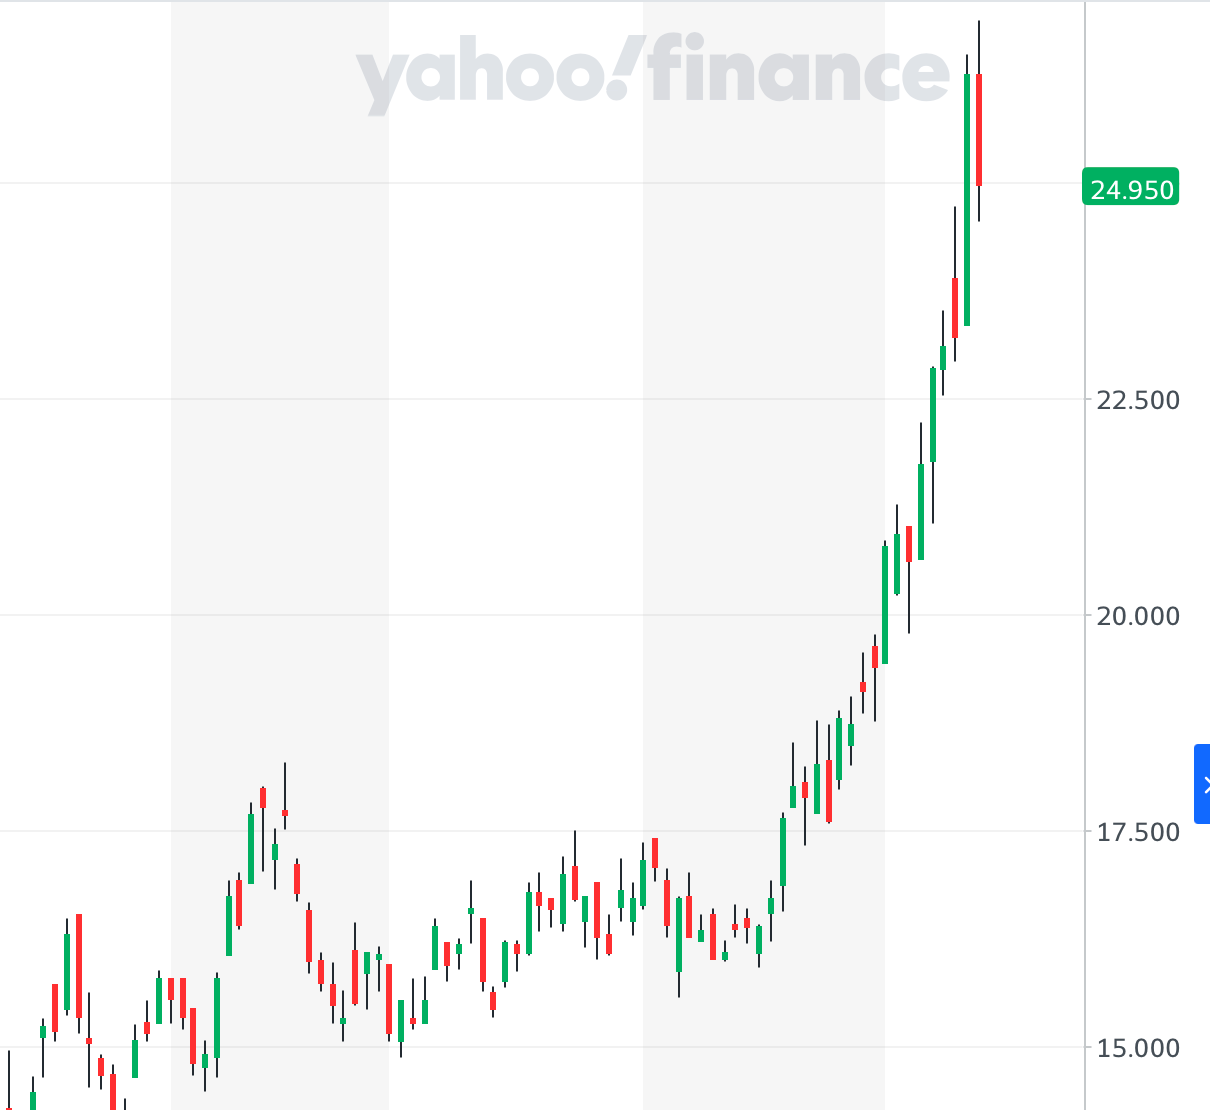
Recently, I had shared an important ETF after spending substantial time researching the crypto space.
This ETF was shared by me around 9 dollars earlier in the year and as of last week was pushing 25. I am a fan of this ETF and I think it could be supported in any pullbacks.
See Chart D below.
Folks, if you are enjoying my take on these markets and would like to receive more such content, help me grow the channel to spread awareness about OrderFlow by sharing and subscribing. Thank you.
The jury remains out on if the dollar action, as well as the rates impact are good or bad for the housing sector.
In many areas in the US, the. house prices are making new highs again. Then in some areas, the housing market is now at 2021 levels.
On balance, the housing market supply is very tight and it has helped the home prices on balance. Several folks are trapped (or comfortable) at 2.5-3% mortgages and that has prevented the supply from hitting the markets. This has taken trauma out of 7% mortgage rates and its potential impact on home prices. I mean if you have a growing family, you want to upgrade to a school district, you gotta move when you gotta move- you are not waiting for the mortgage rates to drop to 2% which may not drop there in a lifetime. These are all good factors for housing.
On the negative side, I do think the employment rate will crack at some point and there will be some housing supply come online and this may lower the prices in some markets. On balance, the housing stocks like XHB have been very strong. I had turned bullish on XHB at 50-55 last year and it is now pushing almost 80. Home makers are making profit hand over fist. Shareholders are pleased. For now.
I think if the dollar declines into low 90s, rates come down to 4-5% , unemployment goes above 4%, these factors in my view should be a headwind for home prices a year or so out - in some areas more than others.
Now I do not think we can get to 2018-2019 prices but I think 2021 prices in many areas could be possible.
Relatively, dependent on where you live, the market is up 50-100% from 2020 prices.
From my plan from last week…
The levels that I had shared - were the high and low of the week, before the CPI. After the CPI, the resistance shared by me became support for rest of the week.
This was followed by me sharing 4556 level on Friday which remained the high of the Friday’s session for most part, with about 5 points of activity above it.
Apart from this, about 2 dozen or so names shared by me in last 4-6 weeks had very good couple of weeks. Many of these names rallied as much as 15-25% in a single session, like $COIN. However for most part, each one of these had good action to the upside with a couple of exceptions. I continue to share these names, almost on a daily basis with subscribers below.
These are not available on any other platform at this time except on this Stack. Market is still very active, there is still time to subscribe and start receiving my exclusive newsletter every day.
The earnings season is also getting started next week with names like TSLA going at it. This is going to be a historic earnings season. Don’t miss it!
Earnings season…
This will be a key earnings season. The expectation is that the market is in an earnings recession. These companies reporting are at an extreme valuations with rates still high. I think this should make for an explosive earnings season.
TSLA
One such name reporting is TSLA on the 19th.
I was a TSLA bull at 100. After it doubled to 200, I have been for most part remained positive on TSLA at 190 for example.
This stock is now pushing 280 area.
So what happens on the 19th? A crash or we continue the upward march?
For me, TSLA has now cleared that 270 level which I think now is a focal area.
I think as long as 265-270 holds on TSLA, we could see a test of 290-300 IMO.
What are other things like TSLA I am watching?
NVDA
NVDA closed at 455 on Friday. I think as long as it holds 465-470 area, we could see a test of 420-430 on NVDA. This 420-430 area on NVDA is quite important as the recent breakout area in NVDA.
I think once we see a couple of closes below this area, it may determine if NVDA gets to start filling some of the significant gaps near 350 area. For now, I want to see if we can hold that 470 which I think if it holds could see us test 430.


