Folks-
Last week was a prime example how OrderFlow can help guide us when volatility rears its head. For weeks and weeks, the market does nothing and then within a matter of days, it makes significant moves. There are months when nothing happens and within 5-10 days large moves can come and wipe out gains or take out the prior highs if we stay focussed.
If we are focussed on the tape, it can help us make the right moves, rather than blindly follow prevailing sentiment.
So how did this sentiment shape out to be last week?
At start of the week, I was bearish at 5330. Can you guess the high of last week?
A point or so above 5330 before it sold off to 5230.
By mid week, at 5230, I was calling for a rally to 5310. This came about in a day or so. We rallied to 5310 from 5230 and then stalled.
At this point, I expected more selling to come and this selling came for most part of Thursday, where we briefly slid down below 5200.
On Friday AM, at the open, I sent a chat room update below, warning that as long as 5200 held, we could rally back to 5250 and this is exactly what we ended up doing on Friday to close the session at 5255, having found some selling at my key orderflow level in intraday time frames.
In my view this is a good example of virtues of patience and let the market make its move first. Once volatility is here, we do not have to predict anything, we can simply react based on what the tape or orderflow is telling us in real time.
Chat updates are a key part of this blog, please subscribe and turn on the notifications to chat. I do not share an update every single day but whenever I see an important set up take form.
Is the worst of sell off behind us now?
No.
Let us zoom into the key events next week which happens to be the CPI data on Wednesday. Wednesday’s auction will be an important auction and will be pivoted around the CPI data that comes in an hour before cash session open on the 10th.
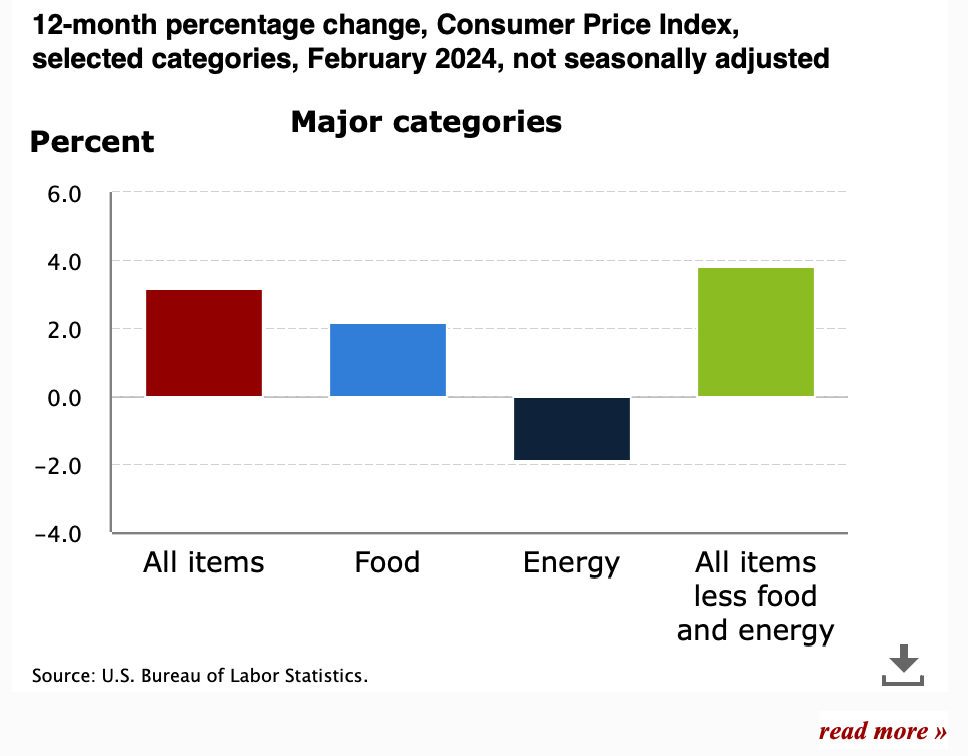
While the FED has been firm on June rate cut, the CPI on Wednesday in my estimate will come out at 0.3%. This will show an uptick in inflation due to recent higher energy costs, as well as higher premiums paid in insurance costs when it comes to housing costs. Insurance prices have seen double digit growths in several large cities which are leading to higher housing costs. These shelter costs are large part of the CPI calculation. See Chart A below.
At 0.3% month over month CPI, the annualized average comes out to be just around 4%. This is double what this FED will like to see. For inflation to come in balance with the 2% goal, the monthly rises have to come in below 0.2% for a couple of months back to back. Until this happens, the 2% inflation target by this FED remains a pipe dream.
Chart B below shows the inflation rate annualized has stalled over last several months. This can be thought to be “sticky” and will not be helped at all by an aggressive FED when it comes to cutting rates as this market has been expecting.
This is exactly what the related markets like Gold and Oil are showing. Despite the US dollar hanging out here in the 104-105 ZIP codes, Gold has been steadily making new highs almost every day, and is now trading 2350 for the spot Gold index.
I have been a Gold bull since around 1600 level and it has since risen by almost 50% within a year or so.
With this backdrop, I think we can see a little more sell off in coming few days as long as we remain below a key level in the SPX index.
SPX index is now trading 5200 and Emini June is trading at 5255.
My key level on the SPX will be 5230 and on the Emini June will be 5280. On the NQ (June) side of the house, I expect this market to remain soft below 18420. It is 18300 right now.
So where do I see some support come in this week?


