Hello Traders-
The main weekly context for this week was to see dips bought, if any into 5130, and strength in general market above 5220.
While we did not see any meaningful dips into 5130, we did see the market firm up above 5220 to head higher into 5320s.
What else worked this week?
My calls in both NVDA and AAPL were spot on. I expected support to come in to NVDA at 860 which happened to be nicely correlated with a weekly low in the stock, and I expected AAPL to find relief at 170 which again coincided with weekly lows before this stock headed higher into 180. See quoted text below from last week’s plan.
While NVDA has eluded a balancing action, AAPL has had its balance and broke it to the downside, as well as carving out a nice gap in the due course. At the very same time, in most recent weekly auction we see an inside auction which means the weekly auction could either trade above prior highs, nor close below the recent lows. I think AAPL action at this point, when it is trading near 172 is fairly binary. 167 is a good support and if it holds, we could fill some of the gaps near 180-185. If 167 folds, this will be an important break to the downside and should not be treated lightly.Due to these reasons, I still think the levels near 860-870 can support the stock, if tested and I will not be surprised if there is another swipe at its recent highs, between 920-950. With other mega caps in the doldrums, I think support coming in for this one stock could help spur and support the general indices in QQQ and SPX as well.ORCL also saw good action on the week but was subdued towards later end of the weekly auction.
Other than these, dozens of other names did quite well which I have shared in recent weeks. These include the likes of PSTG, BLK, RTX, PM, CMG, MO and Oil stocks like XOM and OXY etc. The beauty of these stocks is they have very little weekly to intraday volatility unless some thing major breaks due to an ER or another corporate event.
They slowly grind their way one way up as long as the general market holds up.
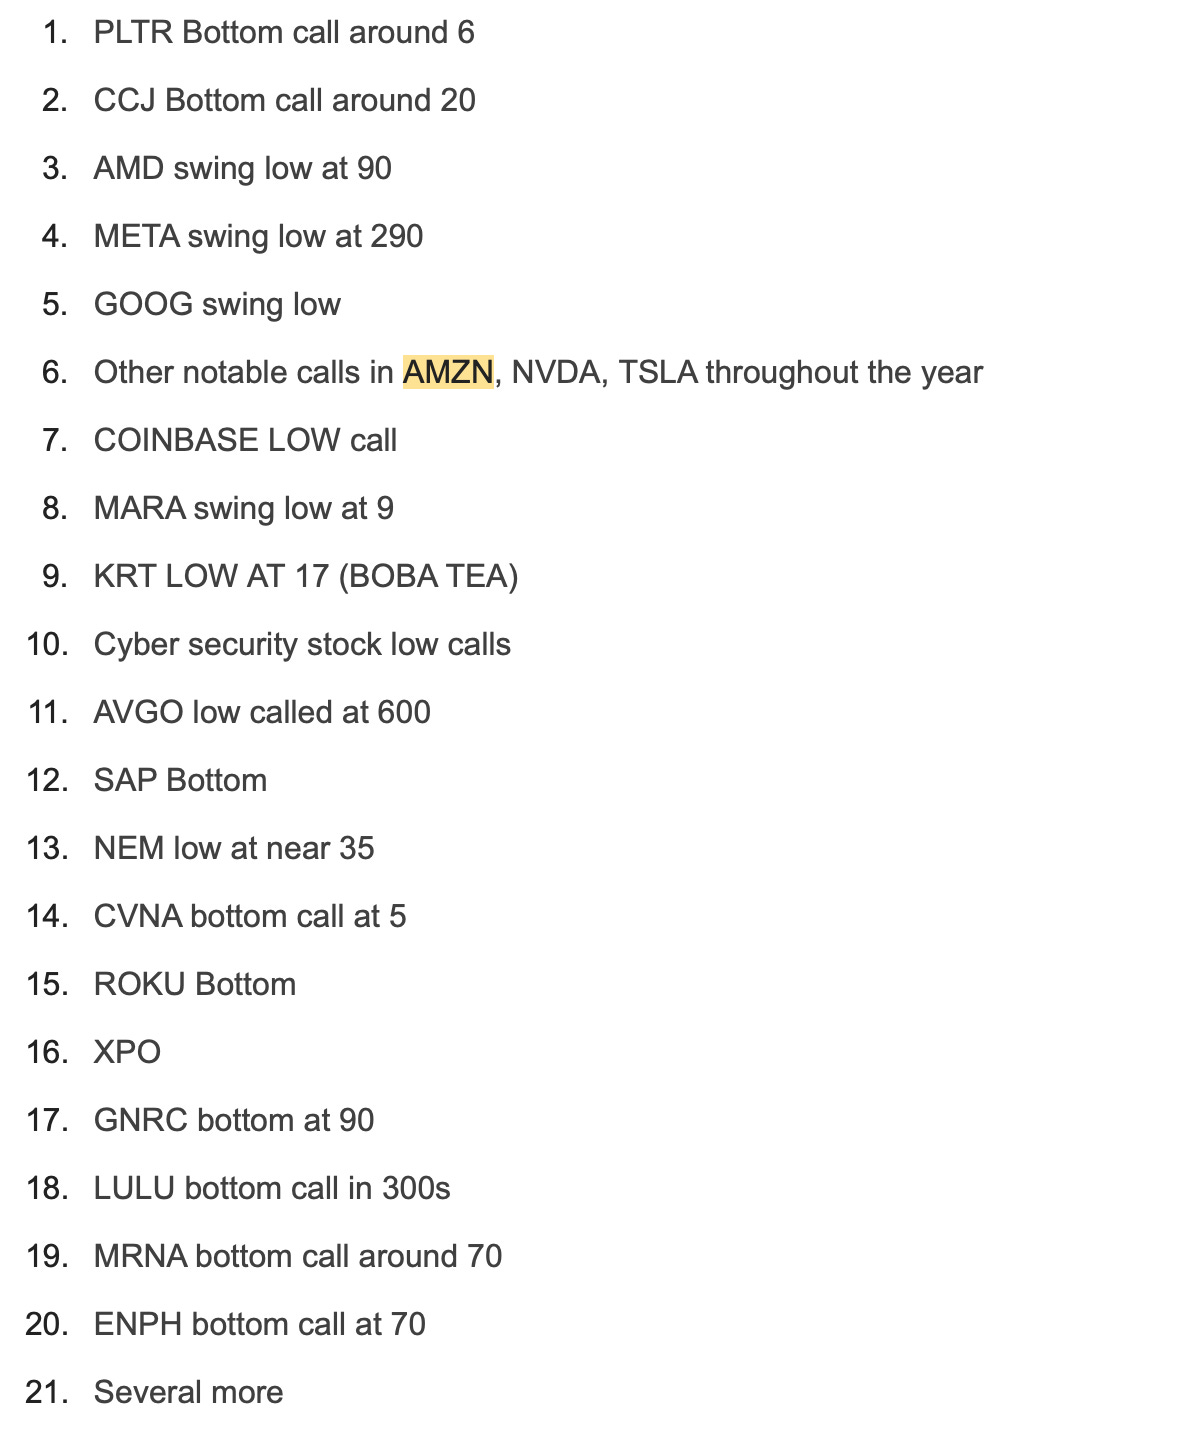
Below is a sample list of stocks I was bullish on about 3 months ago. You can compare where they are now compared to these levels shared about 12-16 weeks ago.
This is a subscriber only list and you can get these levels delivered in your email every day by Subscribing today.
Ten thousand feet macro view
FED talk in last couple weeks, as well as surprise moves from other Central Bankers across the globe were decidedly dovish. No doubt about that. The yields softened, yet the US dollar strengthened above 104.
The market consensus now is for up to 3 rate cuts this year, with the FED also hinting as a slower pace of balance sheet roll off which can quickly morph into Quantitative Easing before you blink.
The high interest rates have started showing up considerable stress in related markets, including commercial and residential real estate. The once almighty housing markets in cities like Nashville, Austin have shed about 11% year over year, rents have fallen more than 7% and the experts are calling this only to be the start.
During the 2020-2021 boom, developers created thousands upon thousands of multi family housing units in these cities such as duplexes, townhomes and apartments to take a dip in steady flow of increasing rents. That rent increase has now slowed down and in many cities, it has actually reversed. If you are in the market for a multi family unit, I personally think great discounts can be had if only one were to wait a few more months. The declines will be precipitous and these housing units will compete with more suburban single family homes once the existing home sellers start offloading them once the FED lowers interest rates, which could be here as early as June.
One thing to keep in mind when you are house hunting is to keep historical economic trends in back of your mind. There are certain cities in the US like the Bay Area, Chicago, Dallas etc which are well established when it comes to industries like Commodities, Tech, Finance respectively. These tend to support housing markets in a downturn.
Then you have the recent newcomers like Nashville, Kansas City, and Austin to give you a few examples (but there are dozens more). A knowledge of historic trends and basic market fundamentals is very important if you are active in these markets for buying a house.
A very simple exercise like searching county tax records for land values will save you a ton of headache down the road. A rule that I use personally is to compare land values say 10 years ago from 2013 to now. Any thing that has appreciated over a 100% just in terms of land values alone is a big red flag for me. Ideally I like no more than 50-60% gains but good luck finding that in this market.
Once you determine a baseline for land value, let us say it is within 90-100% of 2013 values, then I add the cost to build a brand new home, for a medium quality home, in a typical metro area at around $200 per square feet.
For a 2500 square feet house that is roughly $500-$600K. Add the land value and the cost to construct a brand new home on the landsite. This should give you a fairly decent idea of the fair price of the property you are interested in. If the house is a tear down, then consider only the land value. If the house you are interested in has a small foot print, and by that I mean it has very small bathrooms, small bedrooms, not an open layout kitchen, then you do not want to assign a lot of value other than land value alone. Do not spend a fortune on updating a house with a very small footprint as you may struggle to recoup your upgrade costs during a future resale.
For a house that had a land value of $200K in 2013 in Nashville for instance, this comes out to be around $900K-$1M total price, accounting for land appreciation and replacement cost. Any thing above that in my view is unfair price. Now obviously this is more of a boiler plate assumption for an average sized and an average quality home.
You may be interested in buying a water front home with Sub-zero appliances, wrapped around in Calacatta marble. If that if you, ignore everything I said. You probably do not even need to care about fair values.
I have said this now for over a year and results are now only beginning to crystalize for the majority laggards. General perception was that as rate cuts near, the home prices will rise again. Yet we see the opposite.
As we get closer to rate cuts, we see more and more housing inventory now come online. You can find this out by doing a simple online search in your ZIP code. As we actually start seeing rate cuts, I expect a flood of housing supply which I think could lower home prices by an average of about 10% in this year and the next, depending of course on the zip codes.
Despite this week’s gains in the US dollar, in part due to weakness in Yen, these gains I think is going to be short lived. As Dollar approaches 105 mark (it is 104 at the moment), I think it should be prime for a move lower. With the FED in a position of weakness, to surrender despite recent uptick in inflation, growth in the US atleast still quite positive, should fuel strength in commodities and commodities currencies, such as the Australian Dollar and Kiwi.
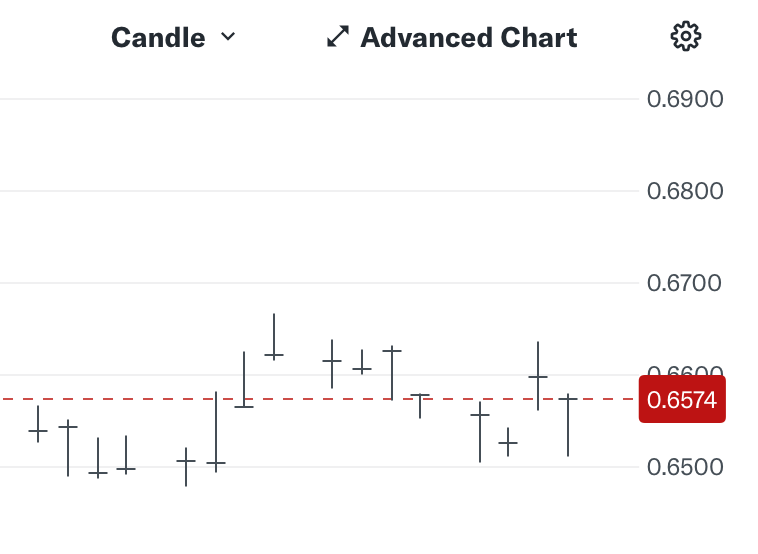
Chart A below in AUDUSD.
If we see Dollar find resistance at 105 area, and begins trending below 103, I think this is going to be a tremendous tailwind for Silver and Gold as well. In the age of AI, when stocks like NVDA have soared several hundred percentage points, Silver and Gold are grappling with decades old resistance levels here. Especially Silver.
If and when they break out of this range, sky is the limit IMO.
Come to think of it this way, the FED has thrown in the towel. They have surrendered to inflation. No more rate hikes. On paper, Gold and Silver bulls now have no more fear of the FED tightening any more. Even if it wanted to, FED can not do much. It is an election year, and they have political bosses who they report to. Little bit of pain at the pump is felt by everyone but they accept it and grin and bear it, as long as the unemployment still remains relatively muted below 4%. Now picture gas being at $4 a gallon and unemployment in the US at 5%. Not a pretty picture.
With this out of the way, let us talk about a couple of ideas I have this week as well as my weekly levels on the main index.
GEO
GEO is a penitentiary stock which I had shared many-many months ago at $7 here in this Substack. It has now doubled and is now trading above 14 dollar mark. Now though it has doubled, some of the tailwinds for this company are still legit.
To start with, during 2020-2021 we saw an experimentation with policing policies across many large cities in the US, and I am sure it can be said for global cities where many of the readers for this blog are from. In fact in most large cities, there was some degree of funding diverted away from policing to other departments. This had an unintended but predictable effect of a spike in violent crimes across the nation.
Violent crime was trending down for several decades up until 2020-2021 when these policies were enacted and has now spiked up again. This in my view should absolutely help these companies like GEO.
The other factor helping them is the migrant surge here in the US. Many of these cities are not equipped to handle this surge and are most likely to outsource the housing and sheltering of the migrants out to companies like GEO. In my view this represents an opportunity for GEO to continue to grow. I think GEO is set to head higher above 20 but interim 11-12 remains an important Line in Sand (LIS) or support on this.
NVDA and SMCI
As far as NVDA goes, I was bullish on it last week when it sold off into 860s. It is now trading above 940. Where do we go now that it is back to its recent highs?
In addition to this, I am currently working on a post detailing what all do I look at within the first hour of opening. This will be a consolidated post, marrying together profiling and real time indicators which I watch to get a feel above key levels thru the day. Subscriber only. So do not miss on a chance to subscribe now and be grandfathered in.


