Weekly Plan 3.17.24

Traders-
The FOMC presser and meeting minutes will be front and center next week, along with a plethora of Central Bank decisions next week, including the Bank of Japan possible rate hike on Tuesday.
On top of that, there is key Econ data out of Canada on Tuesday, as well as Bank of China’s rates on Tuesday. China is seeing considerable slump in its real estate market and there are expectations of another massive dose of Central Ban driven stimulus to revive demand.
From the US FED, the market is penciling in on 3 rate cuts this year, with some participants believing there is a chance for a rate hike on Thursday.
I do not buy the rate hike argument and in my view there is a higher risk of 2 rate cuts this year than another hike or even 3 rate cuts. I think despite the recent surge in inflation data in recent week, the FED will go ahead and cut 2-3 times this year, to bring the year end long term rates down to around 4.5-4.75%. This is an election year and the FED is in no mood to cause a recession. They are also aware amply of extremely low housing sales transactions and since housing tends to be one of the largest employers in the United States, they do not want to rock the boat too hard.
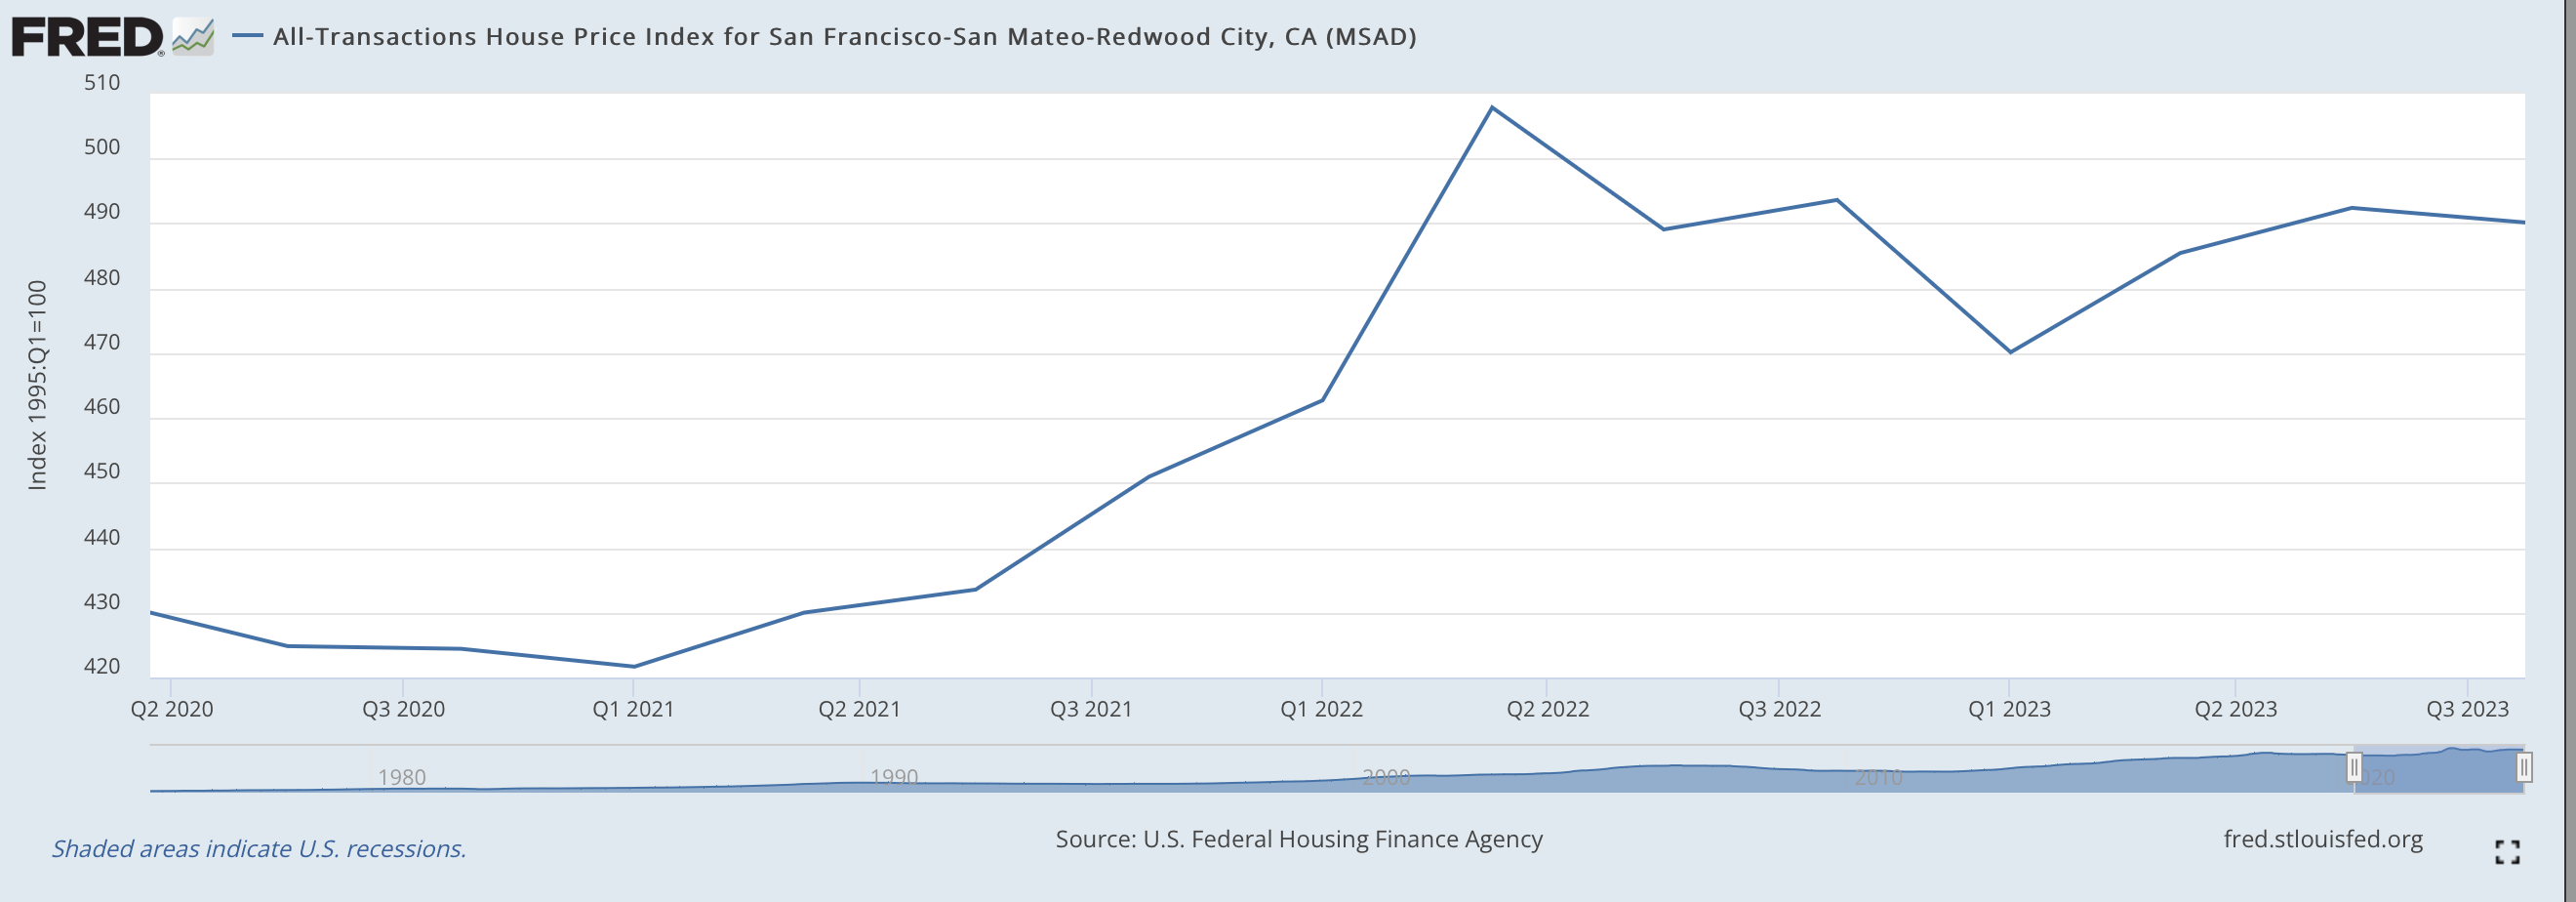
Talking of the housing markets, there is considerable differences in home price growth as well as sales, based on geography.
In recent months, there have been closer to 200,000 layoffs in tech sector, and despite impressive gains in the tech sector stocks, the home prices in last couple of years have stalled in tech industry heavy Bay Area. Below chart shows this sampling using the San Mateo SFO sector.
This trend I think is here to stay and I expect home prices to continue to fall in cities like Seattle, Bay Area etc.
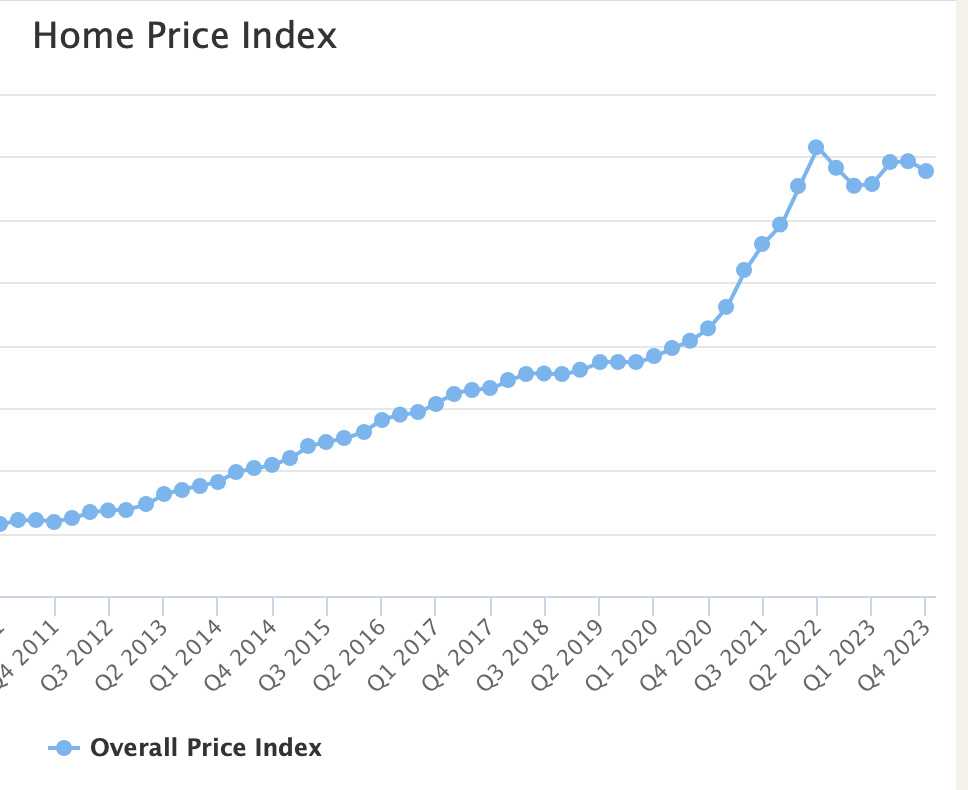
Then you have regions in the South West, such as the DFW metro area, where the home prices have consolidated and I expect this region to stay relatively stable and may even show home price appreciation in 1-2 year out time frame. Chart B below, courtesy of Texas A&M.
In real estate, location is everything. You want to be in regions with strong population and jobs growth. Traditionally in the US it has been the Sunbelt states- North Carolina, Nevada, California, Parts of Florida, Texas, Arizona etc.
On the general index side, the main expectation from last week was to see sellers step in at 5220 from the prior weekly close near 5200.
This call took some heat as the main index floated up to 5250 in earlier part of the week, however on Thursday and Friday I showed resistance at 5250 and then at 5230 respectively. It is here at these levels that we saw most of the volatility with the main index Emini ES sell down from 5250 into 5160s on Friday, before stabilizing a bit.
The action in these key markets, like QQQ, SPX atleast in the short term next week should come down to the likes of NVDA and AAPL so I am going to share a few thoughts on these upfront.
On longer time horizons, the story remains that of the yields and the Dollar index. Despite all that stimulus, both on monetary and fiscal side, the Dollar really has not gone any where for last 18 or so months. It has been perched up here in a very narrow range. In a way this action in Dollar is reminiscent of the action of Dollar during the 1990s, and thru most of the dot com years, before leading to a major bust in the major risk assets such as Nasdaq and S&P500. I think the real move in equities comes on break of 100 on the downside or break of 106 on the upside for the US dollar.
NVDA
In recent couple of weeks, NVDA has sold off about 100 points from its highs. The general market as well has remained under pressure as NVDA becomes more and more inflated component of the index as the 3rd most valuable company.
On Friday I shared in the chat room why I could not be bearish on NVDA so close to that 870 handle. As soon as I posted my chat, we saw a quick rally in NVDA, at one point trading almost into 900 before giving up all its gains.
With NVDA, I have been clear that I need to see 2-3 weeks of balancing that then takes out the lows of the balancing if I were to become longer term bearish on NVDA.
While last two weeks have seen some degree of softness in the stock, I am not yet seeing a break of a 2-3 week ranging market in this one stock.
Due to these reasons, I still think the levels near 860-870 can support the stock, if tested and I will not be surprised if there is another swipe at its recent highs, between 920-950.
With other mega caps in the doldrums, I think support coming in for this one stock could help spur and support the general indices in QQQ and SPX as well.
Barring a surprise move, like a rate hike next week, I still would like to see a couple of weeks or more of balancing action that then proceeds to take out the lows of this balancing before I can feel comfortable about a larger move to the downside.
ORCL
Speaking of mega caps, Oracle was a high flyer that doubled from my levels shared earlier in 2022 and then lost some fervor to trade down into 100s.
A few months ago I sent a bullish post on ORCL at 100 and expected it to shortly rally again. The stock at time of this post is now trading 125 again.
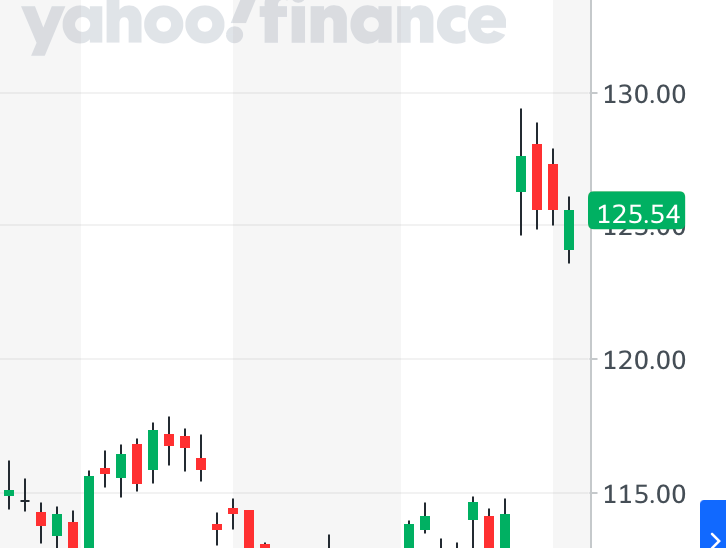
I am a fan of these gap ups on higher than normal volume and I think as long as this gap here on 115-120 holds, ORCL is headed higher.
ORCL main obstacle will be CAPEX required for them to break into AI enterprise space, they do also have a considerable amount of debt. However, if it can make inroads into the enterprise business here in the US with their AI and cloud offerings, this stock could be headed higher.
Its closest competitor in this space is SAP, which I shared below 100 and is now pushing above 180 already. SAP is the larger of the two when it comes to the enterprise business but ORCL is stronger when it comes to cloud business.
AAPL
While NVDA has eluded a balancing action, AAPL has had its balance and broke it to the downside, as well as carving out a nice gap in the due course.
At the very same time, in most recent weekly auction we see an inside auction which means the weekly auction could either trade above prior highs, nor close below the recent lows.
I think AAPL action at this point, when it is trading near 172 is fairly binary. 167 is a good support and if it holds, we could fill some of the gaps near 180-185. If 167 folds, this will be an important break to the downside and should not be treated lightly.
BAX
BAX is another one of those names I shared months ago around 40 but really has not gone any where.
BAX was a bullish call almost one and a half year ago, along with the likes of DVA and VRTX, which I have quoted below.
The business of health has been suppressed due to this pandemic with a lot of people postponing their non essential health care services. When was the last time you visited your dentist?The sector itself has been one of the worst performing- but it’s dog days may be over. I am not getting too fancy in this with the high flying IBB type names but rather stick to tried and tested DVA which I have been a bull on, CVS another one of my favorites as well as VRTX. They last traded 110, 107, 248 respectively.While DVA and VRTX bulls have been rewarded amply, VRTX as much as doubling now from those levels, BAXTER really has not gone anywhere in over a year.
At any rate, 35-36 will be my main LIS (Line in Sand) on Baxter, I think as long as this holds, we may be headed higher into 50 +. It is around 40 now.
GCT
GCT is a tremendous Substack call which I shared here just a few weeks ago at 20.
This stock is now trading near 43. Now the whole point of this Substack is for me to share my ideas before they become mainstream. Just 3 months ago, no one had heard of GCT. Now every one is a GCT bull.
Just over a year ago, no one had heard of SMCI when it was 60 when I shared it in Substack. Now it seems everyone owns a piece of it at 1100.
Look at MARA . I became a bull at 3 (or COIN at 60). Now everyone ended up buying it at 30. I can go on but you get the idea.
The point I am trying to make is the best time to be interested in a stock is when it is relatively unknown. Yes, there is nothing to suggest a GCT or a SMCI can not or will not go higher. But will it be a 20 bagger from here for SMCI? You tell me.
So back to GCT. I think it is just one of those companies which are going to be extremely volatile, whether they go up or go down from here.
I think the line of least resistance may still be higher on it but not without volatility.
It is about 43 now. I think if could remain supported if it were to pullback into 34-36 area for an eventual push higher above 50-60.
SOUN
This was shared by me around 3 dollars only a couple of weeks ago and is now pushing above 8.
Right now I think 7 is a good LIS for me personally where I think we could see it supported, it tested.
If 7 holds, I think SOUN is now headed above 10 dollars.
Emini Levels for this week
So, the main context for this week and possibly next week’s auction is going to be are we going to hold NVDA 860-870. Are we now going to be able to hold above 167 on AAPL? When that FOMC comes online, is TLT still hanging around 90? Is Dollar index below 100 or above 106? These are important related markets and should not be ignored.
With this said, my key level for the week will be 5220 (Emini June) and 5130 (Emini June). These correspond to roughly 5155 and 5060 on the SPX index. The market is currently at 5183 for the Emini and 5117 for the SPX.
Scenario 1: Dips if any into 5130 could be bought for a retest of 5200 on the emini index. We are at 5183 at time of this post.
Scenario 2: 5220 could cap rallies to retest 5170-5180, unless overcome. I will like to see a daily close above 5220 to think that resistance may have been overcome.
Updates to this plan, or any additional levels and scenarios will be shared with subscribers in the chat room below.

This is it for now, traders.
Have a great week ahead. And remember this blog is reader supported by traders.
Like, share and subscribe to ensure I can continue to share Orderflow ideas with a great audience of traders, like yourself.
~ tic
Disclaimer: This newsletter is not trading or investment advice but for general informational purposes only. This newsletter represents my personal opinions which I am sharing publicly as my personal blog. Futures, stocks, and bonds trading of any kind involves a lot of risk. No guarantee of any profit whatsoever is made. In fact, you may lose everything you have. So be very careful. I guarantee no profit whatsoever, You assume the entire cost and risk of any trading or investing activities you choose to undertake. You are solely responsible for making your own investment decisions. Owners/authors of this newsletter, its representatives, its principals, its moderators, and its members, are NOT registered as securities broker-dealers or investment advisors either with the U.S. Securities and Exchange Commission, CFTC, or with any other securities/regulatory authority. Consult with a registered investment advisor, broker-dealer, and/or financial advisor. By reading and using this newsletter or any of my publications, you are agreeing to these terms. Any screenshots used here are courtesy of Ninja Trader, FinViz, Think or Swim, and/or Jigsaw. I am just an end user with no affiliations with them. Information and quotes shared in this blog can be 100% wrong. Markets are risky and can go to 0 at any time. Furthermore, you will not share or copy any content in this blog as it is the authors’ IP. By reading this blog, you accept these terms of conditions and acknowledge I am sharing this blog as my personal trading journal, nothing more.