Traders -
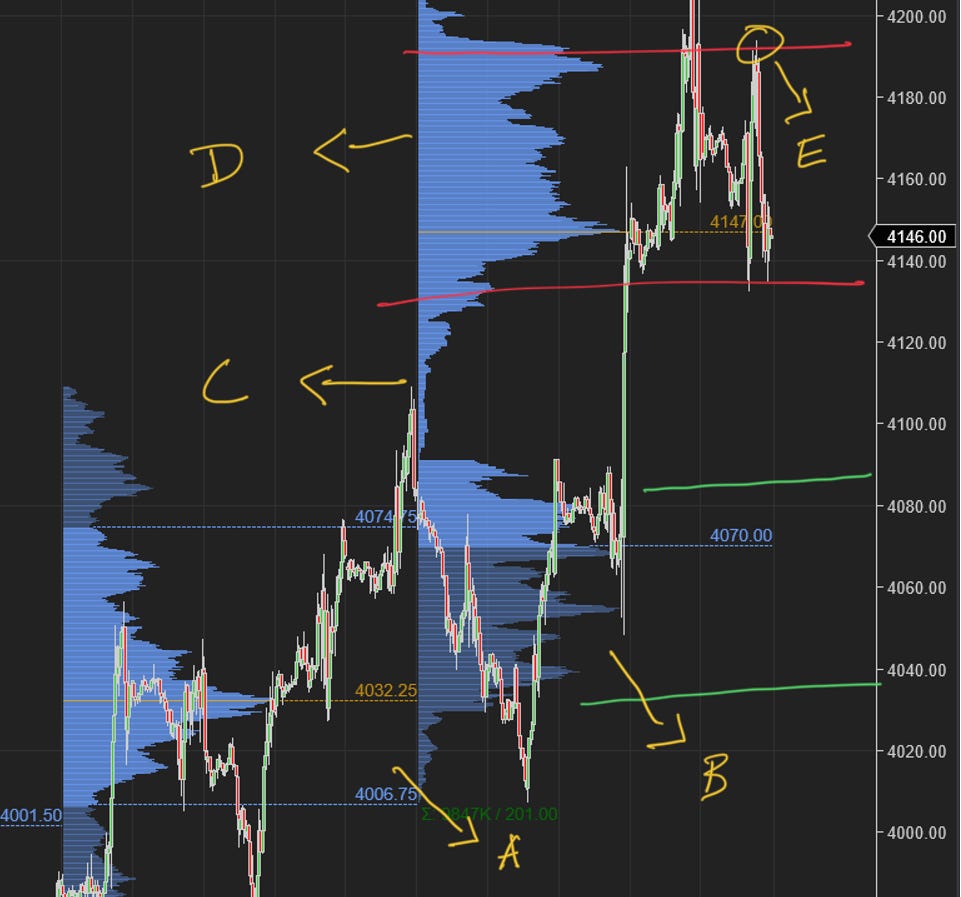
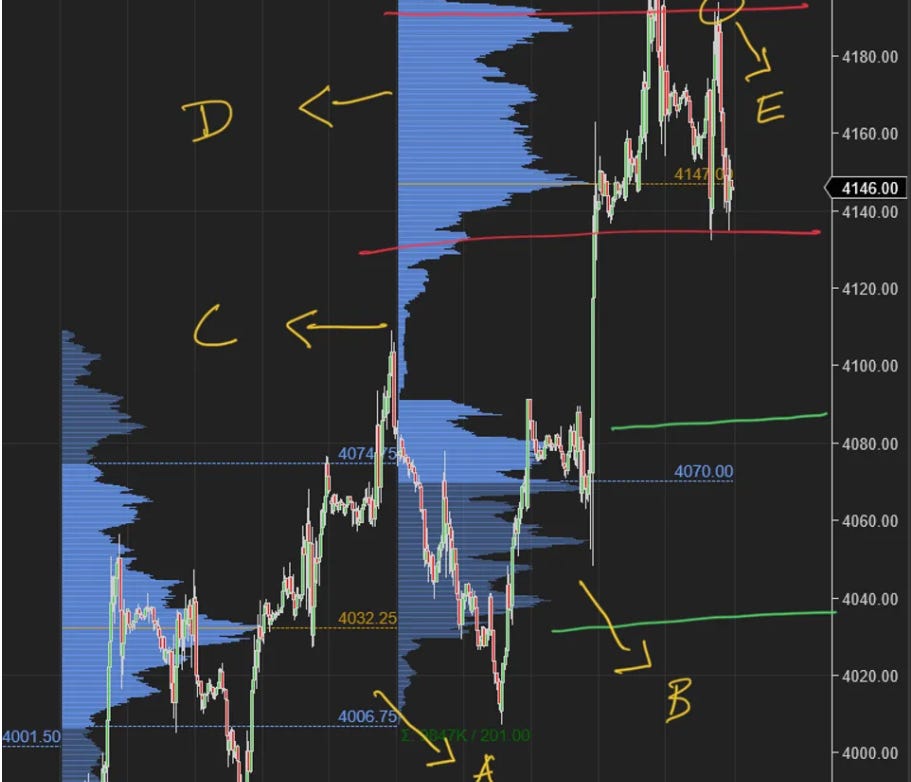
Let us unpack the auction that was last week and how it could offer some clues for the week ahead. Chart A below.
If you are new to this type of charts, I suggest you read this post first-
Diving back into Chart A above.
A- This is the multi week auction Value Area High and there is quite a bit of low volume built up here at this area.
B- This is the first High Volume Node (HVN) of this week, which itself had a large volume on the breakout. There are likely to be some shorts here in this zone.
C- This is the LVN or a gap here where the market broke through previous built up. These LVN can be an indication of momentum and could act as support or resistance dependent on the context.
D- This is the HVN # 2 of this week. Quite a heavy built up of this week’s volume.
E- This is the Friday auction at my OrderFlow level 4200. It tried to take the Thursday highs, failed and formed divergence here compared to the Thursday price action.
Later on in this post, I will refer to these notations and Chart A again so take note of these !
But let us first do a quick recap of the action from last week -
My key level from last week was 4070. I had expected bearish action below this and bullish action, if we bid up above it. If you are interested, you can read through the following snippet highlighted in gray from last week on how I saw the auction at start of this week.
I do recommend readers are aware of continuous auction levels and in that respect on Thursday and Friday my key levels were 4200 /4170 and the market failed to make much headway above those on Thursday as well as Friday, each time selling off into the prior key levels that I shared in this Substack at 4130.
My key level for this week will be 4070 and 4120. We last traded around 4080 on Friday.On the NQ side, my key level will remain 12235.My primary technical thesis and context is that for the bulls here, they do not want to see a lot of closes this week below 4070 area- this from my perspective is signs of weakness here near the resistance zones.Conversely, from a bearish case, while there was a lot of excitement for the bulls on Friday, the close was slightly weak and the bears want to take back 4070 early in the week and keep the pressure below this level. If I am a bear here on the weekly time frame , I also do not want to see a lot of closes above 12235 area on the NQ.Scenario 1: Bearish pressure could remain on the emini S&P500 with no daily closes above 4070 and we could retest 3980-4000 area.Scenario 2: If the intraday dips into 4070 remain supported and we do not see Daily closes below 4070, this is a Scenario that could signal continuation into next OrderFlow resistance near 4120/4130 before finding resistance. We closed near 4080 on Friday.
Market momentum and technicals in my view are always revolving around the fundamentals and macro situation. Even when Macro makes a lot of sense, it may mean the market continues to surprise you when you have a cogent Macro thesis why things should be down or up. This is a feature of the market and not a defect. If the markets did exactly what every one thinks it should do, there will not be any meaningful movements as everything will be priced in at all times!Overall, I had a bearish view on the long term auction (3-4 months out) between 4060 and 4200. While we closed the weekly auction on Friday somewhere between these two levels, the momentum did remain against my primary long term view. Although on the intraday time frames, the market acted as if contained between my intraday levels both on bullish and bearish directions pretty much most of the week. These levels are regularly shared with folks during the intraday time frame via Substack chat.
Price action in the Emini S&P500 was not the only divergence this week
I saw divergences not only in the price action but in other, key related markets as well. These divergences can be important clues and should not be ignored.
For instance, look at the action in the bonds (and I use TLT as a proxy for bonds)-
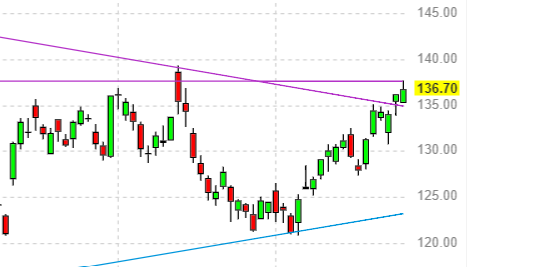
TLT remained subdued most of the week, had a failed breakout and closed near it’s weekly lows.
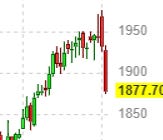
Gold had a woeful week which I called before it unfolded near 1960s.
Initially my thinking was that okay folks are assuming inflation is over and therefore the FED will embark on a rate cut journey which does not really support Gold as an inflation hedge any more. With the FED cutting rates now, the trade is unwinding from silver and gold into growth.
I wanted to confirm this with the bonds, however, this theory does not entirely hold up as we did see good action in the US Dollar also. If the FED is easing and cutting, then there is no reason for Dollar to rally. And rallied it did this week.
We also saw some good sell off in typical “risk on” type names like Australian and Kiwi Dollar ! Most losses however on Friday were sustained by the oil and silver market.
So, overall, money did flow into the US dollar this week, however it was also pulled out of energy and precious metals into high growth names in Nasdaq and the likes of ARKK ETF which all had an excellent week!
This surge in growth names was met with resistance on Friday upon release of a very strong jobs report. The expectation was to add about 200K jobs last month but we added more than half a million jobs! The unemployment rate came down to a 53 year low of 3.4!
Normally this would have crushed the markets however, the silver lining in this report was that the surge in number of jobs was not met with a surge in hourly wages paid which were as expected.
There are nuances in this though:
The way BLS (Bureau of labor statistics) reports this number is actually not based on number of new jobs. So this does not mean 517000 brand new jobs but if due to inflation one is forced to work at 2 jobs, that gets counted as 2 jobs even though it is the same person doing two jobs.
A lot of seasonal workers in hospitality and farm sector for instance are let go in January due to inclement weather. So, if this report is this hot in January, imagine what it could be in Summer? And the wage inflation could tick higher.
It is really very nuanced - a) if the job explosion is due to folks doing multiple jobs to support themselves due to this high inflation, then this means the rates will stay higher for longer. b) let us say the job explosion is due to economy being really very healthy, things are so good that the companies can not fill jobs fast enough. This also warrants the rates staying higher for longer. But if this is the case, we are seeing for the first time in years really bad earnings coming out of AAPL, MSFT, AMZN etc?
Now if the stocks begin a new bull market with a specter looming of 5% interest rates for next year or more , it may be supported by technicals, but it not supported by realities on ground when looked at from a macro lens.
On Thursday we had a so called “Golden cross” in the S&P500 market. This is a technical indicator for those who do not know when we see the 50 day average of the market cross above it’s 200 day moving average.
In past, the results of such a moving average cross have been very impressive:
The last time it happened was in July of 2020 when the S&P500 rose about 35% a year later!
Before that this happened in 2016, when the market rose about 30% a year later!
I do not need to repeat all the statistics but it goes without saying, technically alone this is a very bullish signal - when seen historically.
OrderFlow is not a strictly technical methodology as we look at the flows, seasonality, technicals ofcourse but then also look at the macro, sentiment etc
Personally, I do not give much importance to the “Golden cross” here than let us say I will if the market had already crashed 50-60% or more of it’s highs.
I want to see a deeper pullback from the highs of may be more than 50% and then if a Golden cross happened, I will be all over it!
I also will question relying on the Golden cross to call a bull market when we are in historic inflation (compared to last twenty years or so).
So I personally do not view this as an important development other than the fact that yes this will lead to more FOMO and folks buying some of these names here potentially due to the golden cross coming in at 4200!
Now speaking of inflation hedge, yet again we saw a rally in Bitcoin which was fueled by a surge in growth rather than it being an inflation hedge - Bitcoin rallied almost to 24000 fueled by this rotation- this proves yet again Bitcoin is not an inflation hedge. It is a highly speculative instrument which relies on Dollar demise to make gains - I think Bitcoin will eventually trade 12000 or even lower.
I am all for crypto sector - I like it a lot as an emerging technology. In fact if you look at my first weekly post this year, I warmed up to a lot of Crypto stocks like MARA and RBLX, which are up huge this YTD alone! But I made no qualms about my feelings for Bitcoin and other coins. Eventually, I see these replaced by nation-state crypto coins- yes we will all use coins but they will be centralized and managed by a Central banks. The banks are all too powerful to let go of this control.
And Bitcoin is not very decentralized either regardless of what any one says- and I say this in context of supply. Most of Bitcoin supply is extremely concentrated in hands of about 0.1% of the wallets. No one spends it or uses it- so adoption is very low. Most of the folks who own it are hoarding it for price appreciation. This will be solved by a Central bank digital currency - which will have wide spread adoption as it will have no appreciation but only usage. Read my post below on which companies I like in the crypto ecosystem.
Let us go back to our Chart A and our notes from above to dive deeper into the levels for this week
Primary purpose of the OrderFlow levels is to keep a check on my own biases and helps me measure momentum. 4060 was a great example from last week- we barely got any traction below 4060 and the market dips into and below this were very shallow.
My key level this week will be 4170-4200.
Per my plan from Friday, I do think we have seen the highs of this swing near 4200 UNLESS we begin making some more Daily (D1) time frame closes above this 4170-4200 zone.
This is key- so if you are dozing off by now, grab a coffee and get back to this segment.
So, Chart A from above again-
In the weekly time frame structure, A, B and C are potential supports and will have to be neutralized by the bears by making a Daily or a weekly close below this whole 4060-4200 area.
D and E could be potential resistances - remember in OrderFlow methodology a support once broken can become resistance and a resistance once broken can become support.
B potentially shows trapped shorts with the C gap above them- at first blush they could want to get out if these levels around 4060-4100 are retested giving rise to some degree of bounciness.
On the other hand, assuming D and E is selling, these guys will want to protect their turf and fight any pushback above 4200.
Scenario 1: Daily closes into and ideally below the C gap from Chart A above (below 4170) are ideal for bearish continuation into the 4000 handles.
Scenario 2: if we continue to close back in D and E area, this is potentially favoring bulls and we could want to retest the 4200 area again. At time of this blog, we last traded around 4150.
For my longer term views on this market, read my first weekly plan from January 2023 from the archives.
To receive more OrderFlow structure posts like this, feel free to share and subscribe this newsletter below.
The action we have seen this past week has confounded many - this is not a defect in markets but a feature. I was myself bullish from 3500 handles last year and I had expected this 4100 area retested. Further in my start of the year plan, I was constructive on this market at 3800-3900 and had expected about a 400 point move once the balance broke - 4060 to 4200 is well within my calculated move for this countertrend rally.
Why do I keep calling this countertrend? Is this not a new bull market?
The hesitancy that I feel with calling this a new bull market is the macro picture. Now let us say if you have been a bull from 3500-3600 and want to see how this market does over next month or so, I think you have a luxury and a cushion to fall back on.
If you have been a bear from 3500 and now here we are at 4200, it is a very painful decision to say you want to remain a bear or now flip to a new bull?
This is a bull market - but only in context of technicals. Yes, the technicals are indeed strong and in a traditional “technical analysis” , you will get away by calling this a new bull market.
This is also being ironically fueled by people like me who are waiting for lower prices to “load up”! If you have a lot of money waiting to load up at 3500 then that naturally becomes a support- cash = limit orders. This is why the market may be front running all these limits orders totaling trillions of dollars on the sidelines!
There is only one way for me to reconcile if this was a bull market - and that will be the fact that we are entering a hyper inflationary phase in this economy. This would be marked by an inflation of 20% or more. Are we there ? I do not think so- not yet - and therefore I can not reconcile with the idea that this is a market set to make new highs soon.
I am not shy about sharing my views even when they are at odds with prevailing consensus - this is what made me become very bullish on TSLA at 100 area when it was supposedly going to $20 by the majority point of view - it is near 200 by the way now.
In my first yearly post I had shared some levels which I thought at that point would have been low of the year, if visited- however now with this action, here at 4200, it almost makes me wonder if I need to revise those levels lower by a few percentage points. As we go higher in this market, I think it gathers more power to crash deeper later. Here is the plan, if you have not yet read it or if you are a new reader of my newsletter.
Remember, even though it appears that the FED has already declared a win over the inflation, this will be a sticky problem to solve. I do not recall a time when inflation was won over by FED rates which were less than the rate of the inflation itself. Right now there is more than 2% differential in the inflation and the FED funds rate.
Also, note that seasonally as we get out of Winter, the next few months, headed right into July August are strong months for gasoline price performance. We are also seeing China reopen rapidly and it is already driving prices of some items, like used cars higher. A month ago no one would have believed the car prices would have risen- yet here we are. So these inflation surprise can spring up any time - I would be wary of calling a return to 2% a certainty yet.
Even if we get to 2% this year, which a lot of models are pricing in now, with the earnings decline for the S&P500 for the first time in over 5 years, as well as no new stimulus in sight (at time of this post), I would still think that new highs in S&P500 remain a pipe dream with the FED draining liquidity via asset sales. If the earnings do not improve and the FED does not reverse it’s course on the asset sales, I would say even at 2% inflation and the FED cutting rates this year, this market at 4200 is very expensive. These are of-course my personal views and I may be singing a different tune if some of my levels listed in my plan below are trading in next few months.
Think of it this way.. when the market topped, the market leaders were the last to sell off - they held their ground. The generals were shot last.
If this market were to bottom, I will expect the leaders to rally harder first.
However what do we see instead?
CVNA up 200% YTD compared to 17% for the S&P500!
Even a BBBY with all that talk of bankruptcy is outperforming the general market this year. These are not signs of a very healthy nascent bull market in my view. This is not 2020!
Again, this last couple of blurbs are not analysis strictly based on the tape but my views why I personally can not trust the technicals alone - record shorts, record money on the sidelines can and often does lead to these rallies and when the rallies like this occur, the technicals often begin looking good as well. But price and moving averages alone can not tell the whole story and I think this is what we are seeing now.
Let us now dive deeper into some other names I am watching including few thoughts on some earnings


