Let us kick off this post with some educational notes. Let us leverage few levels that I shared over last 5 days or so to do so.
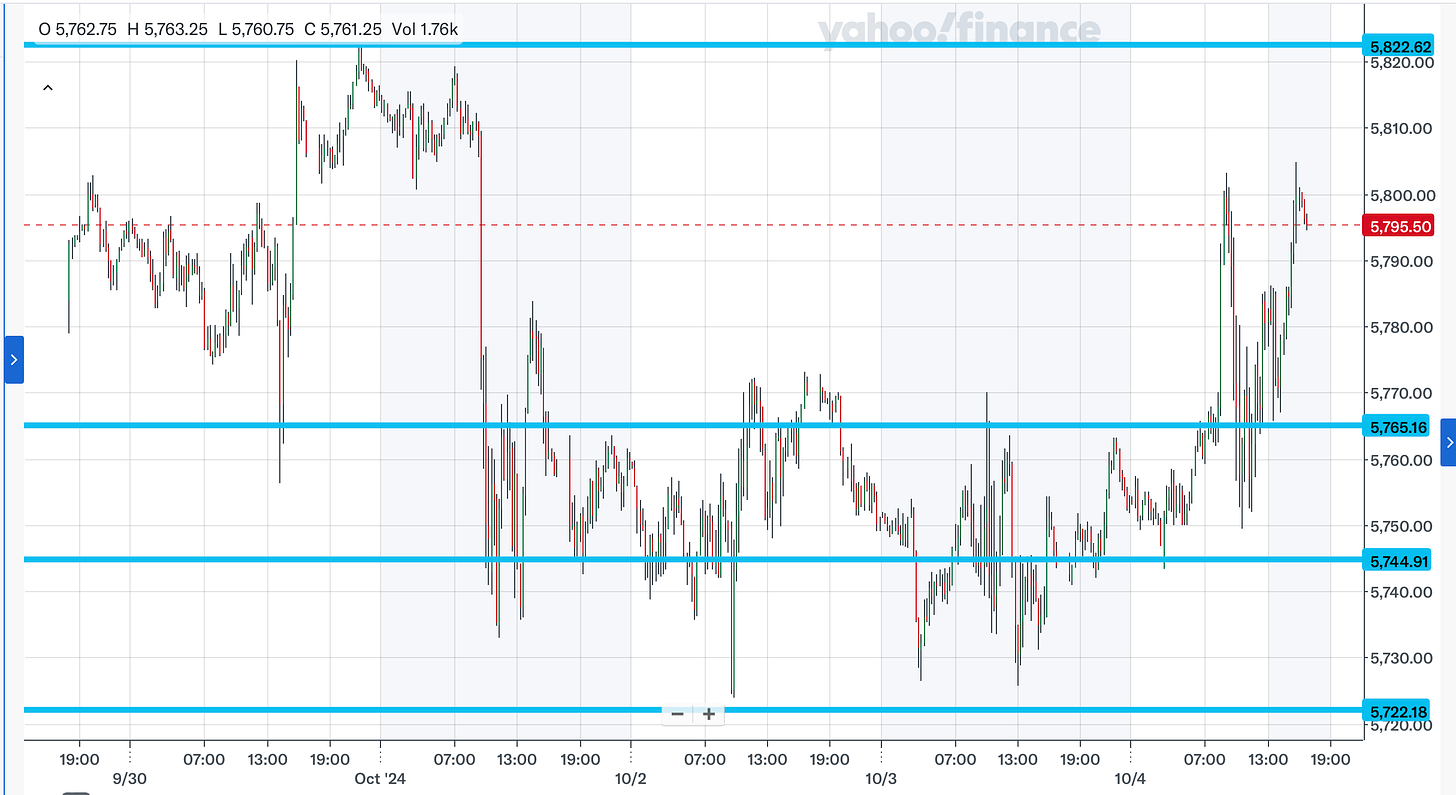
Let us review Chart A below which has last 5 days of auctions on 15 minute time frames, the 4 main levels I shared last 5 days have been drawn in Blue horizontal lines below.
I assume most of you, but not all, either trade SPY/SPX intraday options or ES futures.
There are advantages and disadvantages of futures and options which are not in scope for this blog, but at a high level-
Options market is governed by the greeks. The main challenge for options market is the time decay. You can be 100% right on direction but you may be wrong about timing. We saw this on NVDA on Friday. We were 100% spot on about that 125 close target but had this target been met at the open, the option price would have been much higher than if we reached target in last one hour of the day. This is by design and the market makers like this. Remember most market making is selling options. Market makers are obligated to make a market which in other words means, they are required to provide liquidity. Option buyer takes liquidity, market makers give liquidity. The way I view options is purely as lotto. You buy an option which no one really expects to trade and if it trades, the gains can be hundreds of thousands of percentage points. The downside of course is that this does not happen every day. This is the fundamental nature of options.
Futures market is all about leverage. With a 2% margin, when you buy one contract of Emini, you are putting down $500 to control a quarter million dollar instrument (in nominal dollar terms). This is insane amount of leverage. The main advantage of futures, other than taxes is that you can throw an insane amount of leverage. The main disadvantage is that you can throw a large amount of leverage. For those who are not very familiar with futures leverage, a one dollar move on one lots of emini futures is $50. If the average move now has been 40-50 dollars, this is potentially a 2000-2500 dollar move. One just one lot of emini. However, emini often trades 1.5 million lots to 2 million lots in a day. Most of this emini volume comes from about 100 very large traders here in the US. It is not uncommon for a single large trader to move 10-20 K lots every single day.
The reason I cover this is that you have to understand the nature of the game to play it. And the nature of this game, for most part is choppy waters, range bound action, frustrating back and forth. Smaller your time frame, more choppy it is. We want the market to move in one way- our way, assuming that there is not a single other trader who will sell when we buy and not a single other who will buy when we sell- this simply does not happen.
Now let us go back to our Chart A above. A few things stand out-
If you are buying at 5830 at start of the week, you can see that the market has not gotten a chance to fully develop support and resistance at that 5830.
If later in the week you are selling 5722, you can see why it can be very frustrating. Furthermore, you can easily see that the market at 5722 has developed some pretty sharp rejections, indicating lack of supply there. If that was not the case, the market will spend more and more time there, not less and less.
The situation at that 5765 is mirror image of 5722. Now we see in the middle part of the week, there is simply not much demand at 5765. If there was we will see more balancing there, not less. I am sharing this to show how I develop my levels and the thought process behind this.
Now on Friday, let us say you have hundreds of traders, if not a thousand, short at that 5765 because it has been such a good resistance for most of the week. No one really expected the jobs number to come in so hot. So the market spikes above this range.
What do you think these shorts do when the market comes back to retest it? What will be the first reaction of any one getting stuck in a short at 5765 when the market has spiked up 20-30 dollars above their shorts? They will get out and wait for this level to be regained as resistance. And that is precisely what every one did, turning this former resistance into support now.
Placing trades at areas with low inventory is always a good place from a risk to reward perspective. Knowing levels where traders are stuck in longs and shorts is always a great spot from risk to reward perspective. Why? Because there are fairly objective zones. Either they will hold or fold, you do not have to second guess them.
You can further fine tune these entries using orderflow concepts such as Tic TOP and cumulative delta. See below for a detailed post on some of my active trading educational content like Cumulative delta and volume profiling. This is an important post which you do not wanna miss.
No one and I mean no one knows what the market is going to do next except the trader who is going to lift the next offer or hit the next bid. And Pelosi.
If this was not the case, the markets will stop moving. The fact that the markets still move is the biggest proof yet that no one knows what the market will do next. You have to infer the market intentions using price action concepts like the ones I shared above. Now some of you are probably quite new to this and have been enamored by YouTube and Tik Tok videos where some guy is sitting there with his charts, cherry picking great trades showing how he just knew the future based on some crazy bats or inverted head and shoulder pattern. They have to say all that else you won’t buy their 5000 dollar courses. There is not enough money in the world that can buy a system that can predict the next move in markets. I will pay hundreds of thousands of dollars, not just $5000 for a system which can tell me what the market will do in next 3 seconds, forget about next day!
Look, the reality is the market is an unstructured environment which fundamentally cannot be predicted by any degree of accuracy. Logic, fundamental analysis, macro, charts- if these could predict future, the professors and accountants would all be billionaires. But that is not the case.
You can just have an edge and by that I mean if you can trade a 100 times and win 50% of the times, with winner size larger than your loser size, you are ahead of the game. Markets speak to you but it takes some time to learn their language. Markets speak in price action and orderflow. You have to master this language, just like any other language you may be trying to perfect. The whole thing can take 2-3 years.
I know this is not an answer many of you were looking for. But this is the reality. May be I just saved you years if not decades of wasting your money buying courses or analyzing crazy bat patterns. Just focus on horizontal price action levels and rest will take care of itself. Hope this was helpful. Over the course of next several weeks, I am going to write a long and technical post with price action from next 50-60 days and share my reasoning why I think this price or that price could be support or resistance, and share live examples. This will be included as a bonus post for all our paid subs.
Other stuff on my radar
Let us look at some other stuff that I like this week but before that, let us review some of the other recent moves:
CCJ: I shared this last week at 45 and this week it moved into 50+ along with new highs in Uranium prices.
APP: Shared a couple weeks ago at 110 and it moved into 140 this week.
PLTR: Shared most recent here at 22 and then 28, and crossed 40 this week.
META: Shared at 500 and 550 before closing at 595 this week.
NVDA: Multiple support levels at 100 and 105, crosses 125 this week.
CVNA: 100 to 180.
Dozens upon dozens more which I am not listing all here as they are still in play and are for our premium folks. At any rate, to get most value out of this, try and commit for a year or two of subscription. If you are hopping from subscription to subscription, in search of holy grail, this is not going to be extremely productive as the market will make most of the gains in 5-6 weeks out of the whole year. You cannot predict which these 6 weeks will be so therefore consistency is important.
This has been a stock pickers’ market in 2023 and 2024. Not everything is going up unlike in 2020 and 2021. Part of the reason we don’t have a lot of folks able to capitalize on these moves is 2 fold. One primary one I think is that most folks’ trade from a smaller account and the intent is to hit that “generational wealth” trade. To pursue that folks get into shorter term options. With shorter term options, the success rate is super low. Yes you hit a great trade once in a while but to do it consistently due to nature of markets is simply not sustainable.
The other part is the execution issue. If you look at any and all of these stocks, if you held on to them for a few months to a year, the results speak for themselves. This requires patience and holding power thru 10-30% drawdowns.
In my experience interacting with hundreds of traders and thousands of trades, it is simply not possible to fit these ideas into extremely short term options. Now LEAPS one to two year out are another story.
The reason I keep coming back to this point is that I want this to become crystal clear- unless you take a long term view, it is not going to work out. Over a 100 year time, S&P500 on average returns about 0.75% every month and some of the best minds run S&P500. The odds to beat this are extremely slim. Now if you make 1% a month on average, you are already far-far ahead of these geniuses. If you return 2% a month, year after year, you are a hero worth worshipping, you have cracked the code. What we see instead is the 0DTE crowds, going for 100% targets every single year. This is simply not going to happen, yes you get lucky and that is just like winning the lottery or a blind squirrel finds a nut. It happens in nature for sure. But the odds are extremely low.
Alright with my professorial back to reality spiel over let us look at some interesting set ups ;) -
XOM
Crazy to think that these oil stocks could back to life after all but few traders wrote them off when XOM was trading at 100 dollars.
I have had a bullish bias on XOM for last 2 years or so when it was trading around 60 bucks.
I reiterated this bias a few months ago near 100 and the stock recently made an all time high. The fact that this made an all time high with the oil prices subdued tells a lot.
Due to these reasons, I do not see a reason to be bearish on XOM yet. I think this has more juice to squeeze and I see it push into 150 area.
It is 125 at the moment.
Looking at October 18th 125 calls, I think they look attractive around 1-1.5 dollars if traded.
TSLA
This has been a tremendous orderflow stock since I first shared my bullish view on this at 137, about 5 months ago. It rallied all the way up to 260, sold down into 230s and then rallied on Friday to close at 250.
A lot of folks have a wide range of opinions on this stock which is what makes it so trade-able and volatile. There is valuation and macro worries about this stock but it has been able to push past those walls of worry at time of this post.
S&P500 by itself by some measures now is the most expensive ever in history. You can take this any way you want to but we are simply not going to sell off unless we begin to take some of the support levels out like the ones listed below.
With TSLA my main premise is that you have this 230 level which has been a problem for the bears and they need to take it out.
230 is a good line in sand and I think if this holds, we are set to push higher into 280 on TSLA. It is about 249 now.


