Well, that escalated quickly!
Folks,
Yesterday at 4475, I expected 4380 to trade and fill the Monday gap. I did not expect this to go down this quickly. I was surprised, in a good way. Had a little help from the news media to get to 100 handles lower so quickly. Dow Jones had the worst day of the year yet!
Note: if all the images and charts do not come through in email, please open this post in a browser.
New readers, Please ensure you read these posts below for my overarching thought process and context driving the action this week:
WEEKLY: Click here
Prior Plan: 2/17 Plan
Educational (Optional) : Orderflow Ed (STFU)
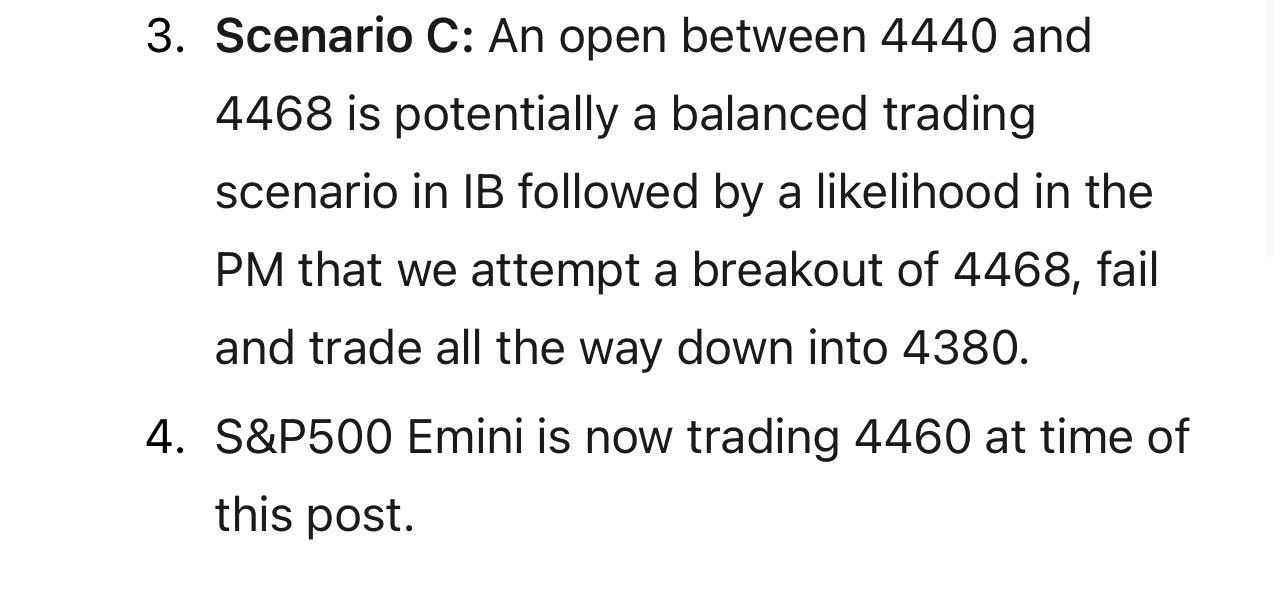
This was a prescient call by me made on Tuesday that on Wednesday the breakout may fail out of 4468 and we may trade down into 4380.
Well sir, that day came today on Thursday, having failed that breakout yesterday and now trading 4368 at time of this post. My trade plan of today actually capitalized on this 4468 and the High of Overnight trade as well as the high of the day (HOD) was 4468.
To follow up I issued several warnings at 4450 and then at 4420 about softness on tape overall.
This was not to boast, though I could claim some credit for being the contrarian and avoiding the crowds going all in at 4600 and then again at 4500. But this is a win for order flow, tape reading and common sense. Hope to keep this going and share my ideas with folks as and when I find them.
Now going into tomorrow, things get a little complicated. Lemme explain why and then go from there for levels and stuff.
At 4368, I do believe we are close to a meaningful bottom and we may soon resume our trek back towards 4500. However this is complicated by a couple of factors:
I do not think this sell off today was due to the ongoing inflation debate.
I think this sell off today was motivated by geopolitics and the market front running some big news which may be imminent soon.
The reason I feel this way is due to how Gold is acting and how other markets like the ten year and the other treasuries are acting. This has very much the undertones of risk-off sentiment.
If this is true, the market will soon come to it’s senses. However, going into the long weekend for the markets (no trading Monday!) , there is going to be a certain risk premium that needs to be padded into the market. Read on to find out more.
Now before the levels for tomorrow in S&P500 emini, let us quickly recap some of the related markets and see what clues if any we can glean from there:
Emini S&P500 :
At first blush the chart does look weak and may break those recent lows at 4350.
AAPL
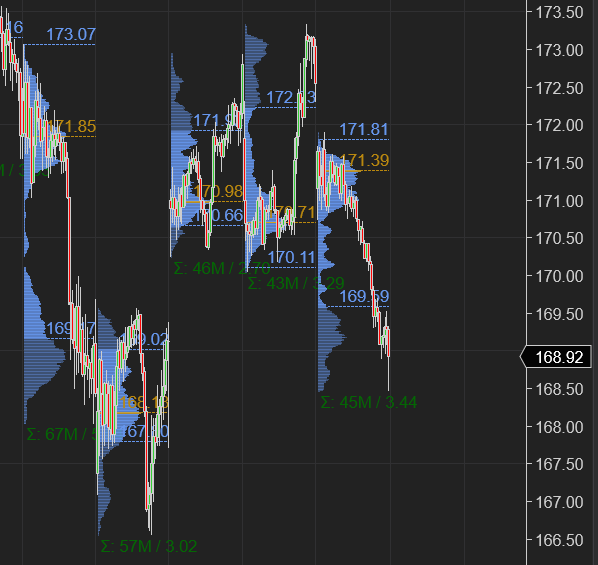
A mirror image of S&P500 emini. I think once we start trading below 166-167, this opens the doors to 155/156.
TSLA
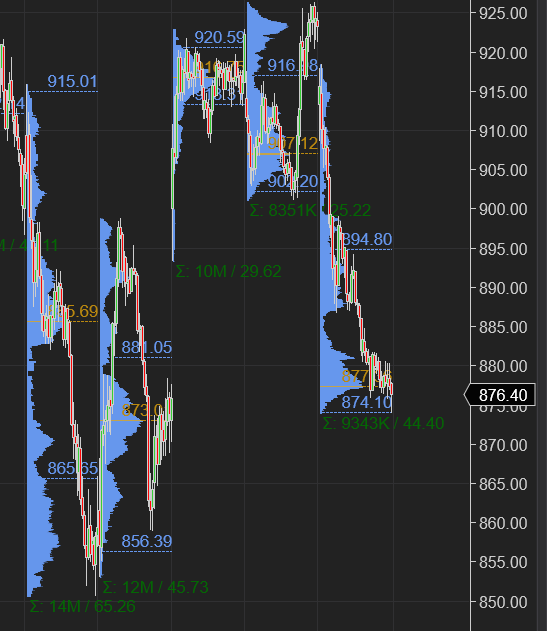
I think we may get to 850 and once/if we break 850, it opens the doors to 780/795.
So the technicals do look weak as of the close today. Let us see if there any other factors worth considering before I draft my price scenarios.
At 4436 , right before the OPEN I sent this note on my Telegram (Figure A). AUDJPY was trading around 83 at time of this post. It started falling after the open, taking the entire market with it. Yen remained very elevated throughout the day. Gold, as a safe haven also remained quite bid.
Make sure you get on my Telegram , it is one of the largest Telegram groups globally. Do not miss an update. Link here: My Channel
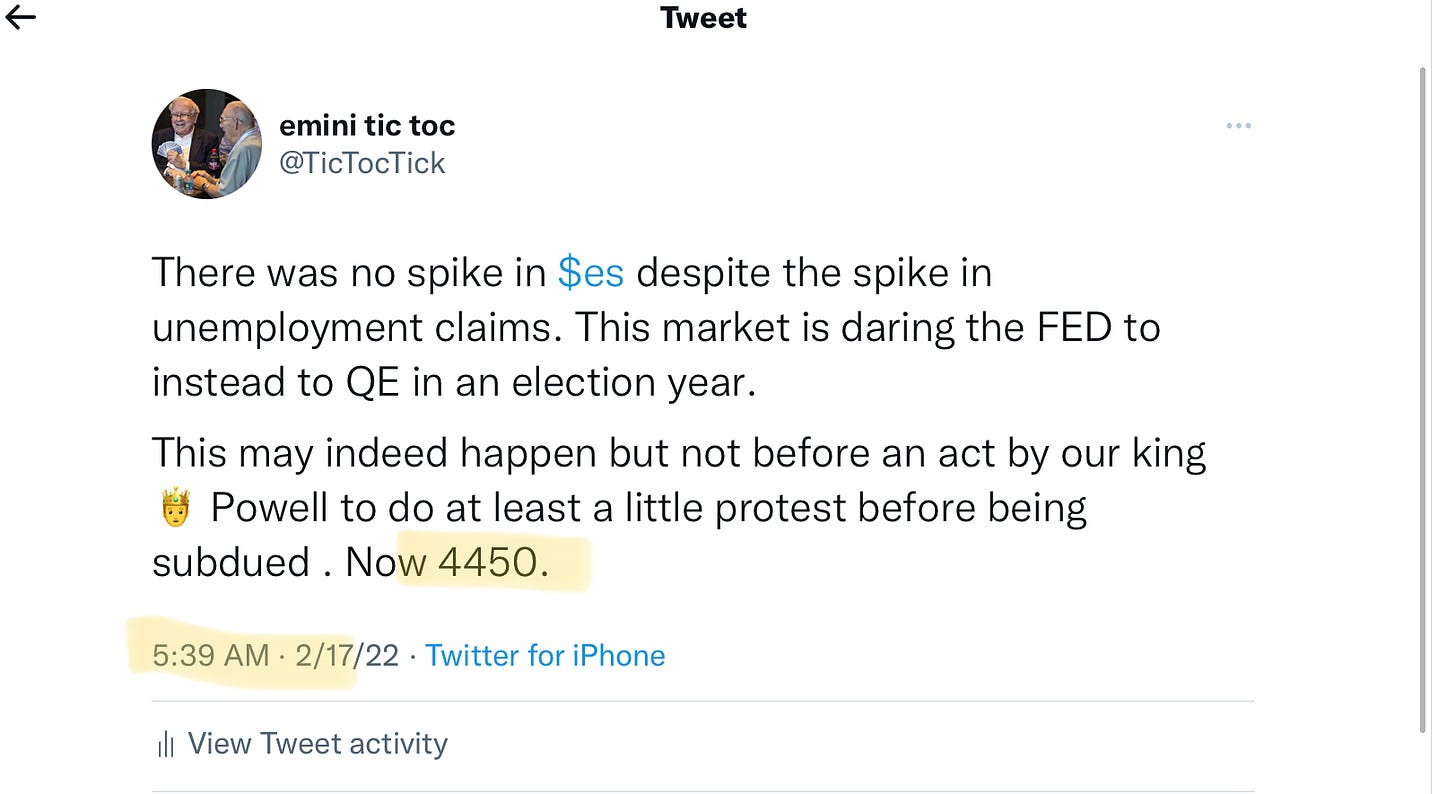
There were some other clues too. There were subtle hints in unemployment claims which sharply rose today . I sent this tweet (Figure B) at 4450 an hour before open. This was yet another warning the market wanted lower today.
Now this is the tweet I sent at ~ 4600 a few days ago. If you look at this in terms of recent lows, I think we are very close to the structure low which is around 4200-4271. So there is that FWIW. I think once /if these lows get tested, we resume an uptrend into recent highs at 4700/4800. See below.
Putting this all together:
So, for tomorrow, my main expectation is most likely continuation of this volatility with an expectations that we may break 4350 to try and trade sub 4311-4320.
Here are my key price scenarios:
My expectation is if we do retrace to 4406-4414 tomorrow, we may find sellers to try and break 4350. My target in this instance will be 4311/4320, if 4350 is broken .
If we open or offer below 4350, this will also be a continuation of the bearish scenario from today and targets 4311/4320.
In case we open or bid above 4406/4414, I think this scenario may take us to trade as high as 4440. I will validate this with where the Tic TOP and TRIN are trading.
S&P500 emini at time of this post is trading at 4375.
The reason for my current bias is that due to uncertainty created over Ukraine Russia conflict, there is going to be some level of risk premium which may be still unpriced. This could be 4310. I would be a little surprised if this number is sub 4300 on close tomorrow.
Longer term, if we do get to 4300, we get to levels which start becoming very attractive to me in several names like GOOG, MSFT, AMZN, TSLA. For instance a GOOG at 2500-2600, MSFT at 266-270, AMZN at 2800 are decent levels. I think a name like ARKK starts becoming very attractive for me at 59-60.
What adds to this view is the fact that I do not think FED will do any thing about rampant inflation. They will let it burn. I think soon the narrative will shift to preserving jobs and the housing market and FED will kick the inflation can down the road. Rate hikes and tightening will take a back seat in a month or so as the FED comes face to face with realities of an election year and the difficult task it has of reducing inflation and at the same time making sure the economy does not die. This also gives them a chance to distribute a little more before the inevitable.
However, I digress. That conversation is another post though. I do not think we are there yet. I will be keeping my eyes glued to the tape to begin seeing signs of some sort of bottoming in market.
Longer term my view has been a balance between 4200-4500 for several days and then a break higher into 4700. That view is now coming very close to fruition.
Think about folks spending considerable amount of money buying over priced homes and other assets when something like a GOOG is right under your nose, selling at 20-22 valuations! The company is barely impacted, if at all by inflation. And at a fair price of 2500-2600 becomes very enticing to me. I also begin to like TSLA which I have been slightly bear on , I begin to warm up to it at 780/795. It closed around 860 at time of this post. I think even a FB sub 200 is a steal. These are the kind of prices which peak Investor Tic’s interest for months if not years long holdings.
We will see once/if we get there. Taking it day at a time.
So this is it from me for now. Brace for another session or two of volatility. I do think we are getting closer to some sort of base forming. Hopefully we can put this volatility behind us next week and begin the march back to 4600-4700.
If you like. my content, make sure you do a like and share as it helps me with the substack algorithm and allows me to reach out to more folks who may be interested in the message of the tape.
~ Tic Toc
Disclaimer: This newsletter is not trading or investment advice, but for general informational purposes only. This newsletter represents my personal opinions which I am sharing publicly as my personal blog. Futures, stocks, bonds trading of any kind involves a lot of risk. No guarantee of any profit whatsoever is made. In fact, you may lose everything you have. So be very careful. I guarantee no profit whatsoever, You assume the entire cost and risk of any trading or investing activities you choose to undertake. You are solely responsible for making your own investment decisions. Owners/authors of this newsletter, its representatives, its principals, its moderators and its members, are NOT registered as securities broker-dealers or investment advisors either with the U.S. Securities and Exchange Commission, CFTC or with any other securities/regulatory authority. Consult with a registered investment advisor, broker-dealer, and/or financial advisor. Reading and using this newsletter or any of my publications, you are agreeing to these terms. Any screenshots used here are the courtesy of Ninja Trader, Think or Swim and/or Jigsaw. I am just an end user, they own all copyrights to their products.


Hi Tic, all, I have taken a chance at writing a "Risk On-Off" indicator, which is based on the TicTop indicator but considering only the price changes on AUDJPY, this code is for TradingView only but can be adapted easily to ToS or other platforms. Please let me know what you think about it:
// This source code is subject to the terms of the Mozilla Public License 2.0 at https://mozilla.org/MPL/2.0/
// © v_i_c
//@version=5
indicator("Risk On-Off", overlay=false)
currentTimeFrame = input.timeframe("","Timeframe")
stock = input.symbol(defval="AUDJPY", title="Symbol 1")
Price1 = request.security(stock, currentTimeFrame, close[1])
Price2 = request.security(stock, currentTimeFrame, close)
diff = Price2 - Price1
plot(diff, style=plot.style_columns, color=diff>0 ? color.green : color.red)
Hi Tic, would you comment about how are you using TRIN when it is greater than one as an indication of a short term low? TIA