Traders-
I was bullish this week at 4200/4300 with the view the market may balance between 4200 and 4500 for quite some time and I was quite right in this assumption as the market made multiple attempts to take out 4200 and failed each time.
This week’s installment of the Weekly Plan I will try to figure out if this assumption still stands, various factors that support this assumptions as well as the factors which may be indicating that there may be more sell off coming ahead.
Note this is a preview post from my substack where I do a longer form analysis about 5 times a week. Click the link below to become a part of my emails to get a copy whenever they are published. I will never-ever spam you. That is a promise.
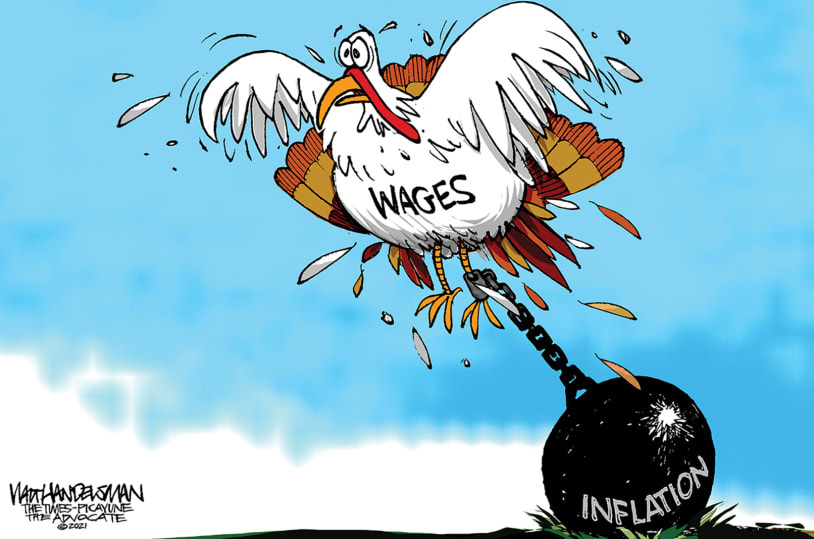
Image above is from "The Week"
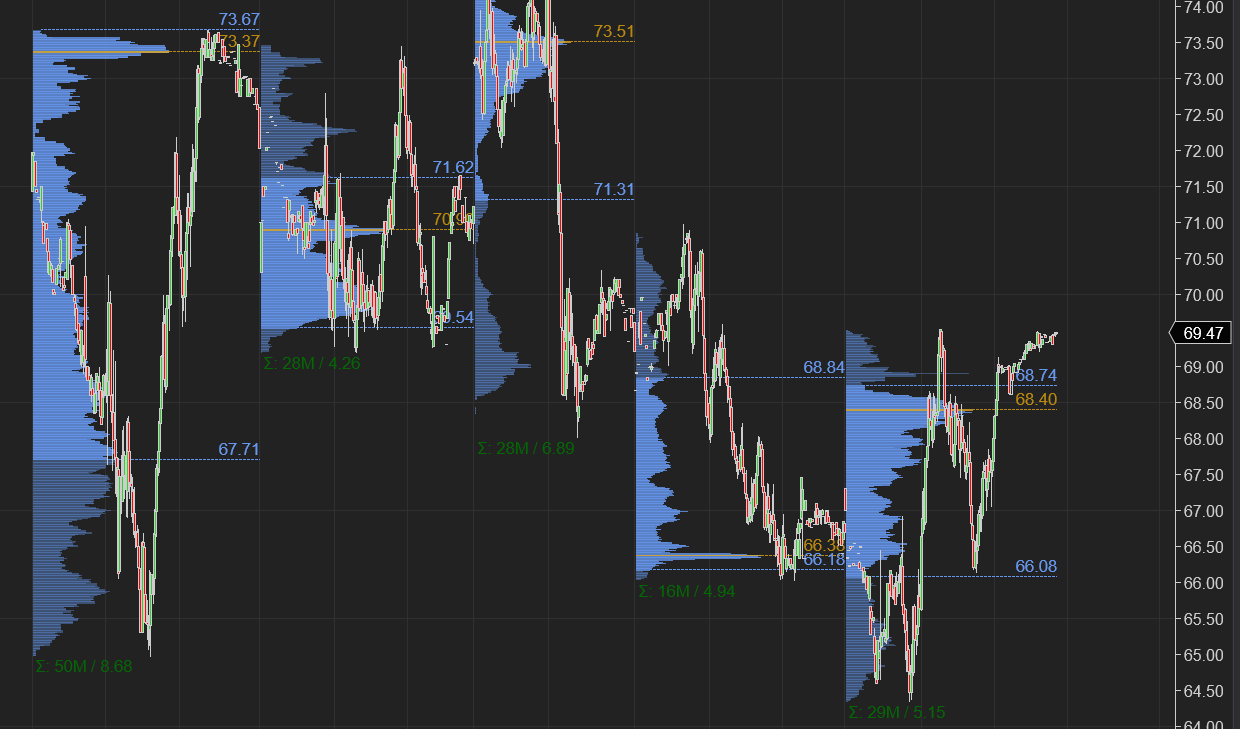
Without much ado, let us dive into the chart of S&P500 Emini (Chart A). This is the 5 auctions of this past week, each graphically representing the frustrations of sellers as they tried to break the lows. Each one of these levels and my context was shared in 5 Daily newsletters this past week. Posts are sent every day around 4 PM, after market close.
From a 10000 feet view, this chart below shows me while the lows were fought bitterly for and won by the bulls, the bulls are not necessarily out of the danger here yet. Read on to find out why I think so.
More than half of the Nasdaq stocks have been cut in half in market cap. Majority, as many as 75-80% are now trading below their 200 DMA . These stats are not exactly the cheerleaders of strong bull markets, if any thing they showcase the carnage that has been done and portends possibly more.
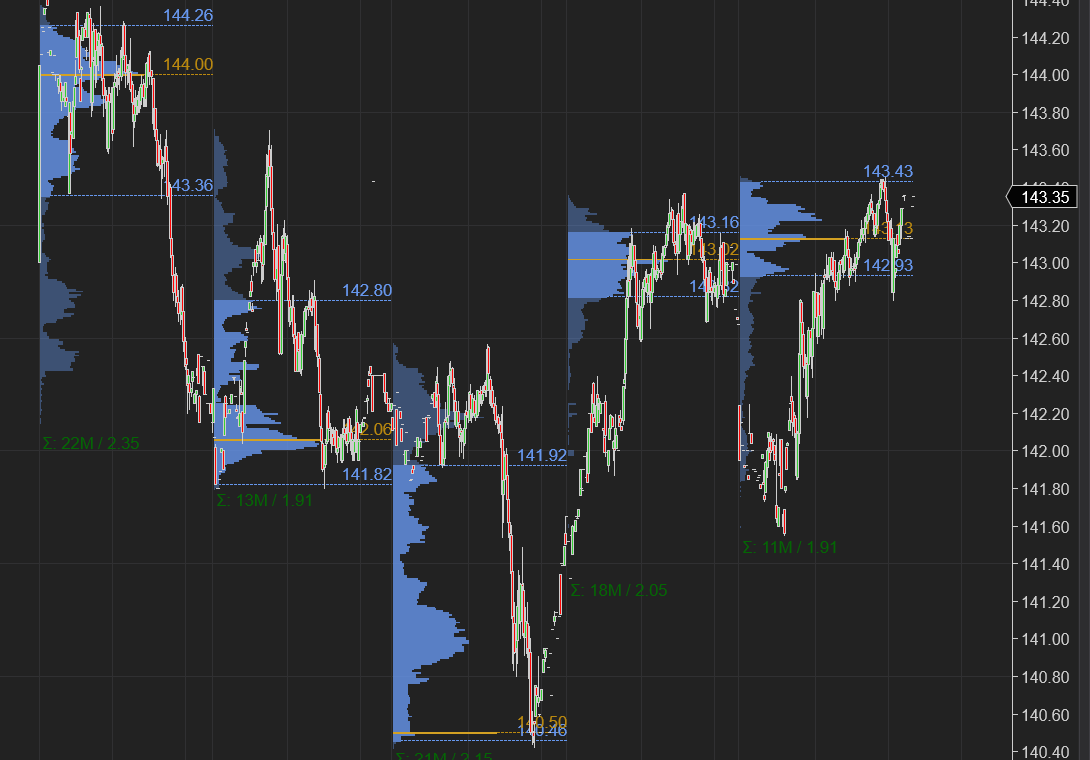
See below chart B for the 5 Day Auction in erstwhile momentum sweetheart $ARKK. Cathie and her ETF has fallen from graces and is now in the dumps. I was bear on this at 125 and is now cut in half, last traded lows around 65 bucks.
Can it rise from here? This profile chart certainly seems to indicate that to me. But not without a fight, and a little help from the FED.
Fundamentals and earnings aside, S&P500 is impacted by nothing more than geopolitics and FED liquidity or lack thereof. 10 year yields are a very good indicator of FED tightening or easing. And I use TLT quite a bit as a gauge of this.
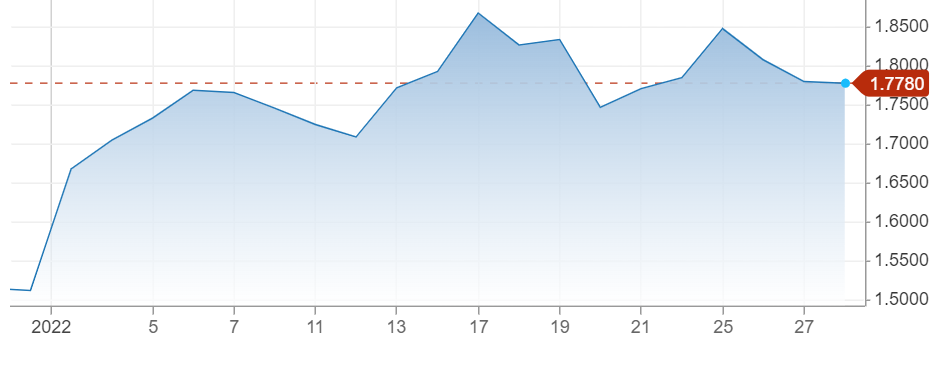
TLT has been stubborn to trade below that vaunted 140 all this week, rallying on Friday, and taking the equities with it. This chart C certainly suggests there may be more juice to this.
Last but not the least, here is the actual ten year bond yields.. Still elevated but down from the highs. I have a theory about where these end up for most of the year, read on more to find out.
Friday was a very good day for the equities. Capping off a tumultuous week. It reinforced my opinion that prices below 4200 will be harder to achieve per my trade plans from last week. I turned out to be right and we closed right above the 200 DMA at 4425. Here is the link to my trade plan from last week, in case you have not read it yet: PAST WEEKLY PLAN
Looking ahead, I am cautiously bullish into dips. At this point in time, I do not see evidence that suggests there will be earth shattering moves either on the downside or to the upside.
My current thinking is that we could balance here between 4200-4500 for few more days before a break higher into 4600-4700. Remember my thinking is not informed by any charts or technical analysis but it is heavily influenced by the order flow. These are the actual orders that hit the tape every day. Order flow can and does change at any time due to macro factors or sudden events. Therefore my opinion can change at any time as a result. However, if we assume the current factors stay in homeostasis, then I have no reason to suspect 4200-4500 thesis is not intact this coming week.
These are the main factors which I think support bullish action:
Seasonality: this is the tax season. There is a natural tailwind for stocks due to various type of tax events, whether that is 401, IRA contributions or rebalancing.
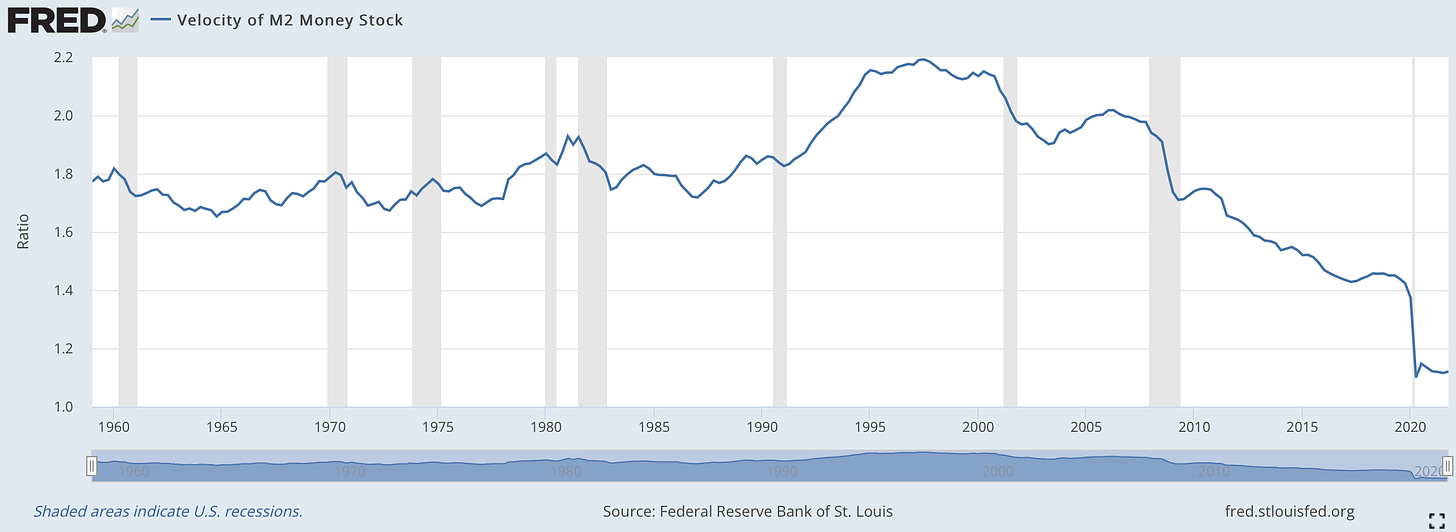
Money Velocity: while CPI has run rampant, the money supply has been in the dumps. This suggests the inflation problem is more demand driven than systemic. Think of money velocity as how many times the same dollar bill changes hands. When the same dollar bill goes from person to person or business to business, several times, it creates more money velocity and IMO those type of movement create persistent inflation problems like we had in the 1980s.
Current inflation situation is due in most part to destruction of supply channels. Demand is there but for how long is any one’s guess. I see as more and more coronavirus restrictions are taken off, the supply may overwhelm the system, driving down the prices. That may be next month, that may be months from now. However looking at mid terms and political scene, I think that is closer than you think.
Valuations: Valuations of some of the bellwether stocks like GOOGL, have already been cut down quite a bit! It is trading at a forward p/e of 19 and I thought at 2500 it was ridiculous! So there is that… yes more sell may come but once GOOGL starts trading at 2300-2500 you oughta think, “man this is silly!”
Ten year yields have come off the highs. I think they will find a balance between 1.7-2 % and that will not be too extreme for the equities.
Then there are factors which are potentially bearish:
FED FED FED: despite the uncertainty around inflation, Powell was adamant about pulling liquidity out of the system . FED is the ultimate LP (liquidity provider) . No liquidity = no stock market. Less liquidity = lesser stock market. I think the way a lot of funds read him is he wants lower stock prices. Lower stock prices are deflationary by nature . So even though the inflation may cool down, if enough people believe Powell wants lower stock market that becomes a self fulfilling prophecy.
Technical damage: S&P500 is within an inch of 200 DMA. It may take lot more than one or two closed above 4410 for calm to return.
Key events next week:
Monday: Chicago PMI and FED Speak.
Tuesday: JOLTS and ISM
Wednesday: ADP pre NFP
Friday: Non FARM Payroll Report (NFP) AND Wage Inflation numbers.
The theme of these events for me will be to see if we are beginning to see the inflation numbers come down or are they still surprising to the upside. Same for wage inflation numbers. With regards to actual job growth, I think we are now in a phase of market where good news is bad for stocks and bad news is good for stocks. So any miss in the NFP number may be perceived to be good for stocks .
Expectation is 166 K jobs added.
With this context and background, here is how I am technically preparing for next week’s trading:
I suspect Friday’s late rally was driven by short squeeze. If so, we may find sellers here at 4430-4454. Key level for me for the week ahead is 4360.
On Monday if we open or offer below 4360, I think more softness may develop, testing the lows at 4288/4300. I will validate this with the Tic TOP indicator and TRIN. See this link if you have not yet viewed Tic TOP script: Trend Trading using Tic TOP Indicator
Break of 4288 will become a bearish event for me and may target recent swing lows at 4210.
In an unlikely event of an open or bids above 4411 on Monday AM, I will be bullish for a test of 4450-4456. Validated with Tic TOP indicator.
Any openings or prints between 4360-4411 may be balance trades for me, in anticipation of the jobs report on Friday.
Remember levels are static . Context and order flow is dynamic. Always validated with other things like TRIN, TICK, Tic TOP, etc
Earnings next week:
There are tremendous earnings next week with GOOG, AMZN, FB, XOM being a few of them..
Keeping in line with my prior analysis of the general market conditions, these stocks while attractive, may find some selling action as well.
AMZN
Amazon specifically, last traded a high of 2900. This stock BTW which I shared at 2700 before a 200 point zipper, if this drops into 2500-2621 on earnings induced swoon may be a buy for me.
HD
Home Depot which was my TOP stock in 2021 has been a victim of recent sell as well. I did not notice earlier it had fallen to the 350 lows recently and if it revisits those lows, I want to be in. Last traded 366.
XOM
This stock shared by me at 60 has been on a tear and could be headed a bit higher after earnings as it makes a climactic high. Last traded 75, in my opinion this may test 82-84 if 68/69 held.
FB
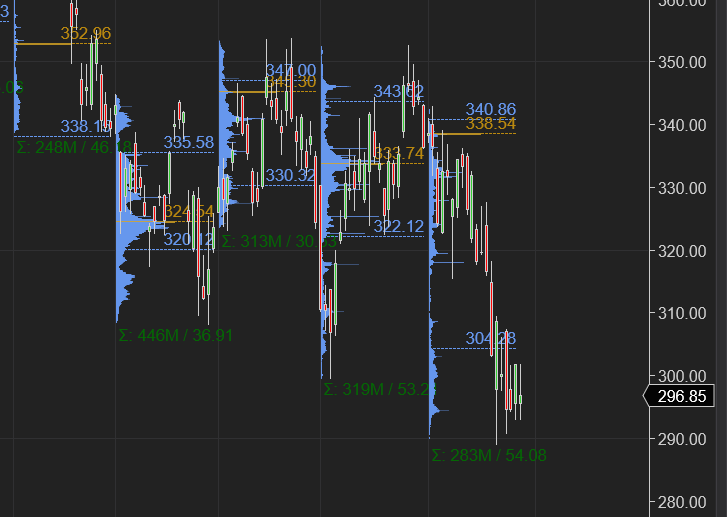
FaceBook has run into some execution issues especially with their desperate foray into Meta and Crypto NFT space. I do not know if this is temporary glitch or systemic issue with leadership/execution. However, I am on alert to see if this stock falls below 274/280 on earnings (last traded 301). If it does , I do want to dip my toes in it and see if it holds.
Subscribers get my earnings analysis before and after key events. Stay tuned as more actionable ideas develop for me.
To Summarize:
I was bullish on S&P500 at the lows last week and was proven to be right as the market staged an impressive 200 point rally off the lows.
While longer term bullish for a test of 4700, I do not think the market is out of the woods yet as may chop around due to technical and lack of clarity on a few important data prints.
That clarity may come this week with flailing inflation and falling NFP numbers. Market paradigm may shift to “Bad news is good news”. Do not get shafted when the paradigm shifts. Markets are forward looking, they do not make next moves on yesterdays news.
Investor Tic is liking the sale being offered on Big Tech names like GOOG, TSLA, AMZN, FB, HD and will buy more if they fall more. Investor Tic time frame is very long (10 years +) with the money he does not need neither today nor a year from now.
Trader Tic expects more volatility. He thinks one more dip before we really firm up on shifting paradigm. But must validate with Tic provided tools like TICK, TRIN, and TIC TOP indicators. Trader Tic shares his levels and thoughts BEFORE market opens, every day. Subscribe to get Trader Tic’s thoughts.
Have an awesome week ahead. Feel free to share this preview of the newsletter to help any one else who may need it.
~ Tic
Disclaimer: This newsletter is not trading or investment advice, but for general informational purposes only. This newsletter represents my personal opinions which I am sharing publicly as my personal blog. Futures, stocks, bonds trading of any kind involves a lot of risk. No guarantee of any profit whatsoever is made. In fact, you may lose everything you have. So be very careful. I guarantee no profit whatsoever, You assume the entire cost and risk of any trading or investing activities you choose to undertake. You are solely responsible for making your own investment decisions. Owners/authors of this newsletter, its representatives, its principals, its moderators and its members, are NOT registered as securities broker-dealers or investment advisors either with the U.S. Securities and Exchange Commission, CFTC or with any other securities/regulatory authority. Consult with a registered investment advisor, broker-dealer, and/or financial advisor. Reading and using this newsletter or any of my publications, you are agreeing to these terms. Any screenshots used here are the courtesy of Ninja Trader, Think or Swim and/or Jigsaw. I am just an end user, they own all copyrights to their products.



Great write up tic. I wanted to share a thought as well if I may. I have also been of the mind that inflation would ease some and provide some tailwind for markets. However with the recent omicron variant running rampant in places such as Asia where a descent amount of product and supply chains issues could hinder deliveries and availability I am questioning my theory that things would improve and could actually get worst therefore worsening or prolonging the inflation scenario. I do sense that inflation will top out here in the next 1-3 months and should start to alleviate. The bigger question is heading into end of year will we settle at 2-3% in November/December or will we settle at 4-5%? My guess and I hope I’m wrong is 4-5%.
That said, will the fed continue to raise rates into a slowing economy ? If so, that would be a huge policy mistake and could be very detrimental to markets heading into 2023 and keep a lid on markets for another year+. While structurally I am a bull, I have serious overall bearish concerns longer term. At this stage, I just don’t see how the fed could
maneuver a soft landing. This is investor Sean ruining out loud. Trade Sean thinks we balance as you do until the next move at or around Feb 18th monthly OPEX expiration. The markets are extremely hedged for a sell off and we all know markets don’t crash when markets are properly hedged. They do so when they are not protected and are forced to hedge forcing dealers to hedge the sale of puts which is in itself a loop that drives markets down. We would need extremely negative put flows between now and expiration below 4300 to take us lower
Tic @HeleneMeisler poll closed with 62% bulled up into next week. I fear most went long calls for Monday or Wednesday next week and the most liquidity will be found with moving price lower testing the resolve of these new found bulls. I think a retest of 4360/4336 may be in the cards Monday or Tuesday and if those levels don't hold another test of 4270. At that point maybe a move higher back towards 4500. For me, I don't see much difference in this pattern from the period 9/20 to 10/13 of 2021 except much wider balance range. Thanks for all your work and teaching