Traders-
The die has been cast, the stage has been set for a major move in S&P500 and we are going to witness some epic swings this week.
Make no mistake, the odds against a market rally are overwhelming.
You have 40 year high inflation numbers, you have softening of economic metrics from the manufacturing indices to employment to the consumer confidence, you have misery at the pump, misery for the home buyers and now you have unfortunate geopolitics conflict and misery of the war. If this was not enough, you have a FED which seem to have embarked upon a path of tightening, and shrinking it’s balance sheet.
Could the stocks even close green let alone rally to new highs in these conditions. Here is my take why I think they can..
Personally for me, I am seeing a variety of opinions and calls on FinTwit and elsewhere- a majority of these are being driven by emotions. The events in play at the moment are of a nature to evoke emotion even amongst most stoic of a person- so I understand that.
I however will not let my feelings mix up with what I am seeing on the tape and I will continue to follow the tape and accept and respect it’s message. This is the same tape that was screaming bearish at 4800 at start of the year and screaming levels like 2470 in GOOG, 410 in SPY, 265 in MSFT last week.
So without much further ado, here is another installment of my weekly trade plan. Remember as always, this is not a recommendation to buy or sell anything, this is simply my personal opinions and my personal trading journal which I am happy to share with folks.
In this installment, I am looking at S&P500 next week, I will be reviewing a couple of earnings on my radar, like Costco and Zoom.
Before breaking down S&P500 technically, let me summarize next week’s key macro events. These are the planned macro events. I very much expect unplanned, unannounced events to stir up bouts of volatility in the market, as has been the case last few weeks.
Major News:
Quite a bit heavy news week with a lot of inflation news coming out of Europe, UK as well. FOMC speak with Powell testimony tapped this week. On top of that there is an expectation that OPEC may boost production to bring down the oil prices.
Monday:
Chicago PMI in the AM . Zoom ZM Earnings.
I will also be watching the RBA cash rate decision. Commodities and commodity currencies like AUDUSD have been on an upswing. I consider AUDUSD as good metric for risk on or risk off behavior and if it gets bid after the decision, I think it may portend well for the equities.
Tuesday:
US ISM Manufacturing PMI- this is the barometer of manufacturing and economic activity in the US. This has been making lower lows in recent months and could be headed for another low this month. This may be one of the inputs being priced in by the market to see if we are headed into an economic downturn and how much wherewithal the FED will have to continue to remain tightening headed into a recession. In past, the economy has headed into the recession well after the FED has started the tightening process. If it gets too painful, the FED reverses course. This may be the first time ever that the economy runs into recession , even before the FED has got a chance to raise rates even once in this cycle.
Wednesday:
Big day with the ADP numbers as well as FED speak with Bullard and Powell scheduled to speak on the same day.
ADP non-farm MoM Payroll report: this has also been making new lows recently and a lower value yet again raises the question how much can FED tighten when the economy stares at the abyss.
I expect this to be a significant important day in entire week, even more so than the NFP Friday!
Thursday:
FED Chair Powell testimony continues.
Friday:
The NFP day! Wage inflation, the actual jobs gained/lost for the month as well as the labor participation rate. Personally I will be looking for a situation where the participation rate continues to climb and the wage growth pulls back. The actual number of jobs has been meaningless for a while and the number also gets to be revised quite a bit!
Weekly recap:
Before looking at this week, let me quickly also review how my plan did from last week. Here is the link for those who have not yet read it: Weekly Plan 2/23
I was bearish on ARKK at 65 and expected sub 60. The low of the ETF was ~ 56 before a sharp rally on latter part of the week.
I was bearish on S&P500 emini at 4350 and expected 4271. I expected much more volatility on a close below 4271. Low of the week in emini was 4100.
I expected a bounce in COIN stock at 189 . This did NOT happen and the stock closed at the lows below 177.
Towards end of the week , I became bullish at 4100. Here is my trade plan at the exact moment I turned bullish from bearish: I Flip Flop from Bear to Bull at 4100
4100 was low of the move from 4600 to 4100 before a 300 point rally in 2 days susequently.
I shared GOOG at 2470, MSFT at 270, AXP 180 before major rallies. In mid of week I shared ENPH which had a decent swing from 147 to 155.
Options Flows:
Now look at some of the flows in $SPY options as a proxy for the overall market, the Monday expiry has a high put to call ratio indicating the market may be too bearish going into next week.
For the Friday expiry, again the PUT flows seem a little bit more bearish compared to the call flows.
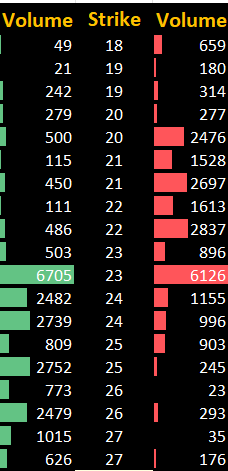
Further looking at the options for the VIX ETN, we can see at one point last week there was heavy volume into those 24-26 calls before it settled down around 22 bucks.
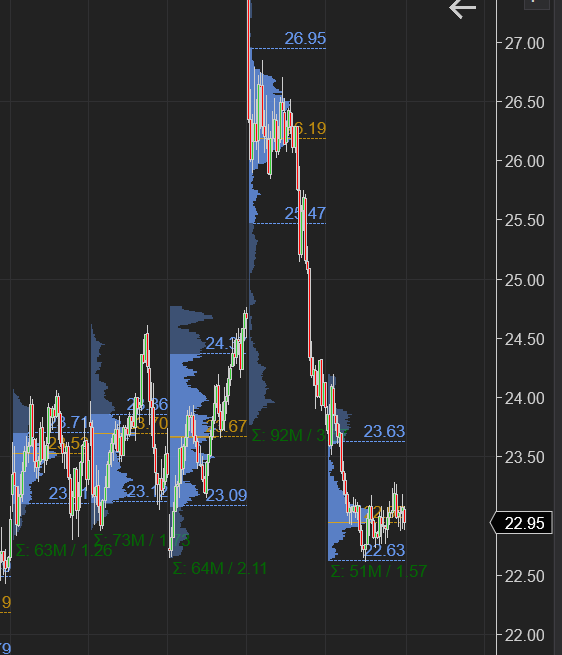
A profile chart of the VIX ETN shows it crumble back into the balance after that initial spike above 27.
So this does show to me that while the fear was elevated, it subsided a bit on Friday but may have some room to run. However , any rallies into VIX may get sold is what I read from this chart.
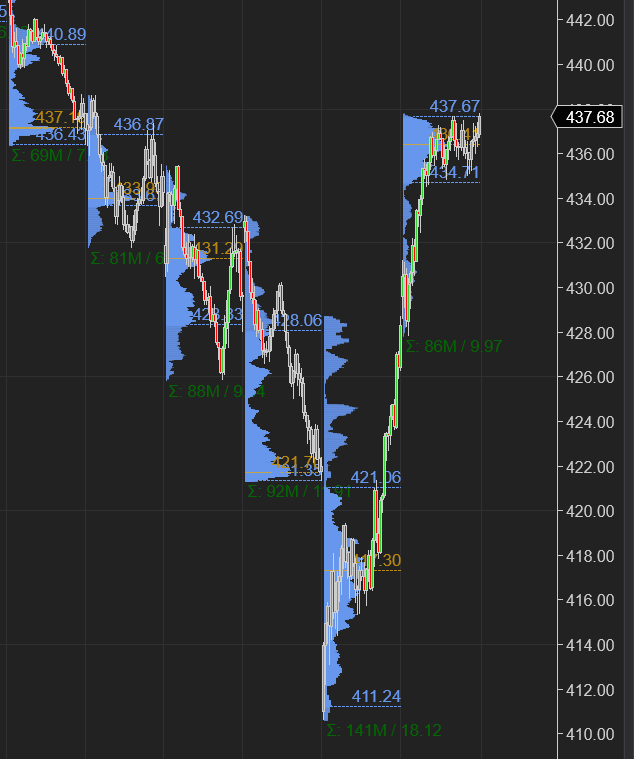
Looking at the SPY chart.. extremely strong run off the lows and on Friday but it did end up forming that infamous “p” shaped profile. Often (but not always) this may mean we pullback a bit.
Now any analysis or DD can not be complete without considering the foremost events of the day which happen to be the Ukraine Russian conflict. I am NOT an expert on this by any stretch. I do not know the who, why and hows of this saga. I will let the internet sleuths come to that conclusion.
This is a FREE sample of my Daily Plans. Subscribe below to receive more.
The part that I do know is we are making history with what we do and specifically what we are not doing. I do think we are taking short sighted decisions today which will have a long term impact and not in a good way for the Western institutions.
From my perspective, the conflict for the most part has been priced in. With the exception of 2 factors which I think are an unknown at this stage for me:
Military escalation between Russia and NATO: this can cause a short term sell and long term uncertainty. This is probably also least likely.
SWIFT exclusion of Russia: this may cause short term volatility and long term side effects on the US dollar but I expect this volatility to smooth out over time unlike #1 above. This is also very likely.
Now look, eventually these conflicts eat away at the dollar and our credibility but have a natural tendency to get resolved. Short term yes the dollar may spike as that is by default and habit whenever these wars get started, the dollar gets stronger. But longer term do I think is this sustainable? Not at all.
If you look at some of the related markets, like Gold and Oil they seem to echo my sentiment.
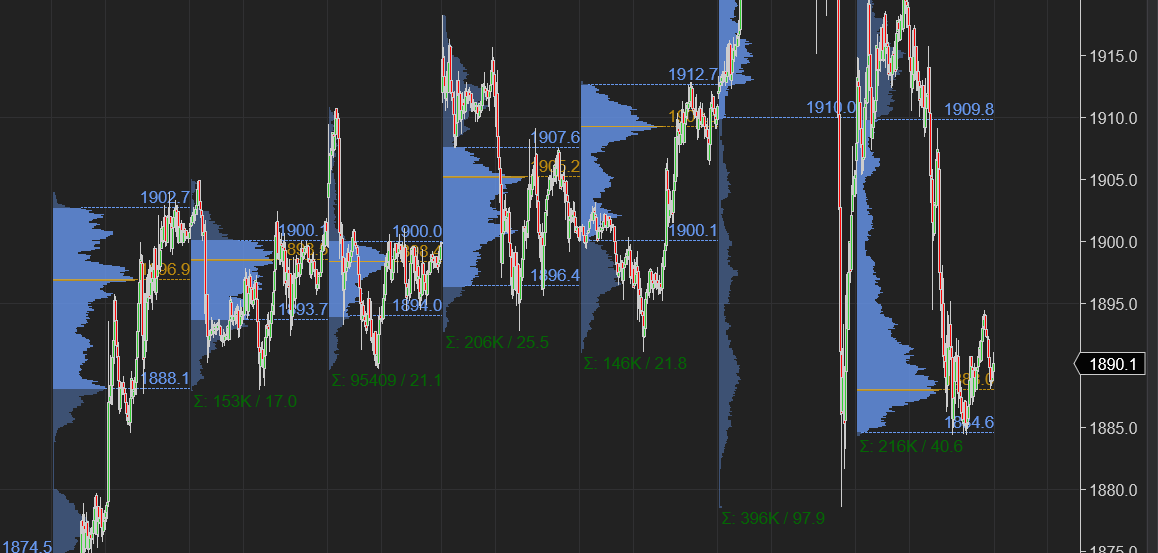
Looking at the Gold chart this is a ditto image of the VIX chart from above. If anything, this indicates the initial fear driven rush into these names is going to subside over time.
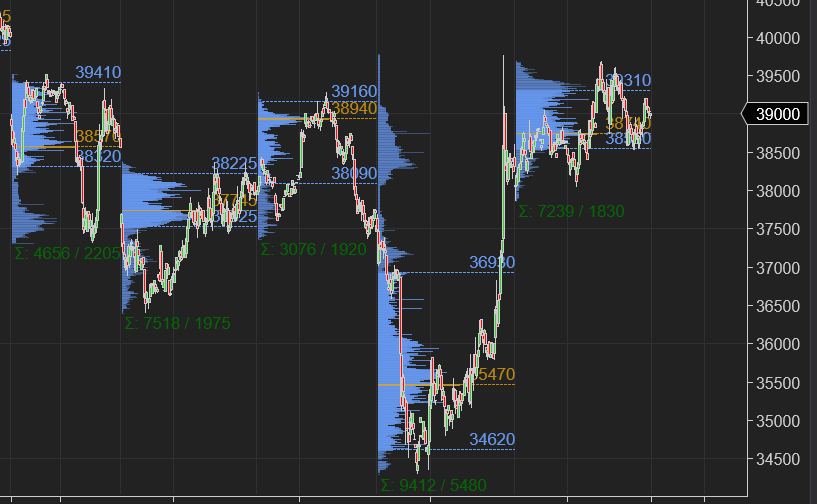
As soon as the Gold market sank, Bitcoin rose. I thought this was an extremely interesting move. My view was Gold was more of a speculative move into 1970’s and I thought Bitcoin formed a good base at the 34000-35000 zone before this move up. I personally think Bitcoin may benefit from all this conflict. If I can see a close above key order flow resistance 45000, I think a run up to 60000-64000 can not be ruled out.
Do note I had been earlier bearish on Bitcoin late last year down to 33/34 K from 62 K. While my targets had been 28/29K, I think given current context, if we do manage a close above 45K, the lower targets will be invalidated.
Now looking at next week, for those of you who are long time readers of this letter know my view since January sell off has been some sort of balance at 4200-4500 before a move higher into 4700.
This view was reinforced in January when the sell off magically stalled at 4200 and we moved up to 4580. Then we sold off from 4580 all the way down to my 4110 before closing the week again at 4380. A lot of people are calling this a bear market, and it may very well be. But consider the fact that for this bear market, we are barely moved an inch away from the 200 DMA.
Despite the rate hikes, FED tightening, this war now, S&P500 has been trying. She has been holding up. The zone of 4200-4500, while threatened many times, and while bruised by extreme price swings, for most part has held. Yet again, stocks like GOOG, TSLA, MSFT have so far held their 2450, held their 730s, have been able to hold on to their 270’s.
This in my opinion is strength. Not weakness. What is aiding the equities is a doubt about how much can FED really do? Do I really believe these doves who have been doves for 30-40 years , will they now transform magically into hawks and embark on a path of sustained tightening raising the rates from 0% to 5, 6, 7 %? Not at all. I do not see it happening.
If anything, the current Geopolitical conflict has cast more doubts about FED’s ability to even raise a half percent in March. So these are my personal views and they seem to align with the message the market is sending.
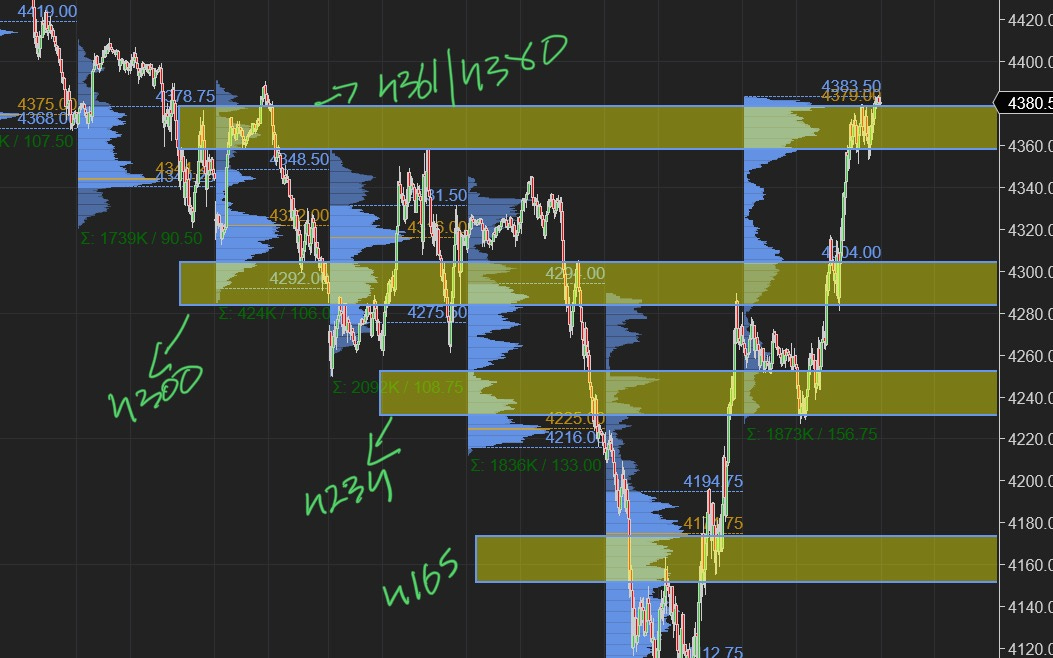
Do I expect we get to a 4500 or a 4700 in a straight line? No, given everything else there will be bouts of volatility. On Friday afternoon the market may have seen some distribution at 4380 and it may mean we come off a little from those highs. Eventually as long as these bracket parameters at 4165-4200 hold, I think there is a chance we revisit the highs at 4500-4700.
So given this context, my analysis of flows and technicals, my current view is the lower end of my 4200-4500 bracket has held, so it may make sense that we test the upper end of this bracket as well.
Here are a few levels and themes for me going forward for the week of 2/27:
S&P500 Emini closed at 4380 this week and I thought it had small distribution at the upper end.
This may mean we sell off at start of the week. But the sell off may be brief and may get brought on balance. See more context below.
I think depending on the extent of escalation in Ukraine Russia conflict , we may sell off as low as 4234-4251. However. I expect this dip to get bought, with a test of 4380-4410 shortly thereafter.
A Daily close below 4234 may add to additional volatility. 4165 is my key LIS and if we start closing below 4165, then my bullish bias may be void on a weekly time frame level. This scenario , if materialized will be covered in more detail in a subsequent post.
Key levels have been depicted below. S&P500 Emini closed at 4380 on Friday after noon.
My Main Scenarios for Monday:
My LIS for Monday session is 4300. I think as long as we remain BID above it, with the Tic TOP indicator in agreement (+2/3), we may see 4380-4410.
If we open or offer below 4300, then the 4234 level may be visited. See above chart E.
I will confirm this with related markets like Gold and VIX. Tic TOP is key in all of this and should support both bullish and bearish case.
To Summarize:
I am bullish on Emini S&P500 with an expectation that the current geopolitical events may cause volatility, causing a dip into 4234/4251 on an impulse move. I expect this level may be supported for a re-test of 4380-4410. This is in alignment with my current view that we are going to test the upper end of my bracket of 4200-4500 before next move is decided, which I think it going to resolve itself with a test of 4700.
For this week, I see some volatility which may lead to a range bound action between 4234-4410. Minor levels in between are 4300.
A Daily close below 4234 may cause a test of 4165 which is my LIS for weekly time frame and potentially causes more volatility below it.
Earnings and some other names:
While most of the market has been languishing, some of the names shared by me earlier are holding up well. This is a long list and does not include everything but a few prominent ones are:
LMT and RTX: Defense plays (LMT goes up from 340 to 410 at time of this post)
AXP , BAC (150-195)
VALE, NEM
ADM, SFM , APTS etc
I expect names like this with actual earnings and dividend payers will probably continue to do well this year. Even some of the High Tech names like GOOGL and MSFT are in same category- their valuations are also now not so extreme any more.
GOOG in particular has held my 2450 level several times . MSFT seems to respect my 265 level.
Another such name I am eyeing is Reliance RS. I think this looks good on a pullback into 170 handles for a move into 200-205. Chart below.
As far as earnings go, Costco COST reports on the 3rd. I have been bullish on COST all through the 300-400 and was recently bullish on this at 480 before it moved back as high as almost $520. They have solid earnings, sales and dividends with 100 % payout ratio, no doubt about it.
The part that I will question here is their ability to keep their dirt cheap margins low. For member only warehouses, I think this is going to become a problem.
This may very well become a CMG like situation where I was bearish on CMG at 1500 before earnings- the stock managed to jump after earnings but ended far lower at 1300 after things settled down a week or two later. I will pass cost at 520- I think I prefer a 450-460 on this name.
Now ZOOM ZM reports tomorrow and is now trading at 125. This stock is now down almost 70% on the year. Even though it is in decline longer term, the question I am most interested in is if the stock is cheap enough to have a bounce due to one of these earnings calls.
Is that number 125?
Well in a perfect world, I see it dip down into 100-110 level (which is also my LIS) post ER and we see ARKK which is one of the largest holders of ZM dump all their stake at the lows. Hopefully then we see a 20% rally in this name. Just like we saw with PLTR.
Regardless, I think a 100-110 is a decent zone for ZM with resistance at 150-165. Strictly for a swing play not a buy and hold for me.
This is it from me for now. Be back with more on Tuesday.
Updates if any to this plan will be shared on my Telegram and Twitter. Here is a link to join my Telegram: Telegram
For new readers, make sure you all read through this post to understand the terms used here. Plus some orderflow educational material. I am working on a new post on cumulative delta which should be out shortly : Orderflow Education
~ Tic Toc
Disclaimer: This newsletter is not trading or investment advice, but for general informational purposes only. This newsletter represents my personal opinions which I am sharing publicly as my personal blog. Futures, stocks, bonds trading of any kind involves a lot of risk. No guarantee of any profit whatsoever is made. In fact, you may lose everything you have. So be very careful. I guarantee no profit whatsoever, You assume the entire cost and risk of any trading or investing activities you choose to undertake. You are solely responsible for making your own investment decisions. Owners/authors of this newsletter, its representatives, its principals, its moderators and its members, are NOT registered as securities broker-dealers or investment advisors either with the U.S. Securities and Exchange Commission, CFTC or with any other securities/regulatory authority. Consult with a registered investment advisor, broker-dealer, and/or financial advisor. Reading and using this newsletter or any of my publications, you are agreeing to these terms. Any screenshots used here are the courtesy of Ninja Trader, Think or Swim and/or Jigsaw. I am just an end user, they own all copyrights to their products.



these posts just keep getting better and better! well done sir!
Thank you sir!!