Traders-
Coming into the session today I was expecting a sharp rally off 43xx handles , however with the caveat that the strong downside impulse move may first push us down into 4200-4250 .
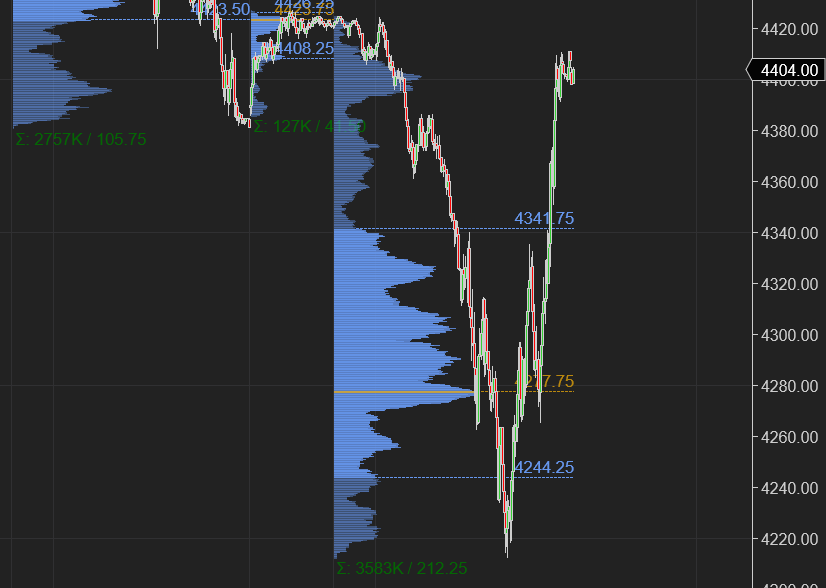
The sharp rally came but it came off the lower end of this range at 4210. Rallying as much as 200 points within 2 hours to close at 4410. Indeed a very strong day off the lows.
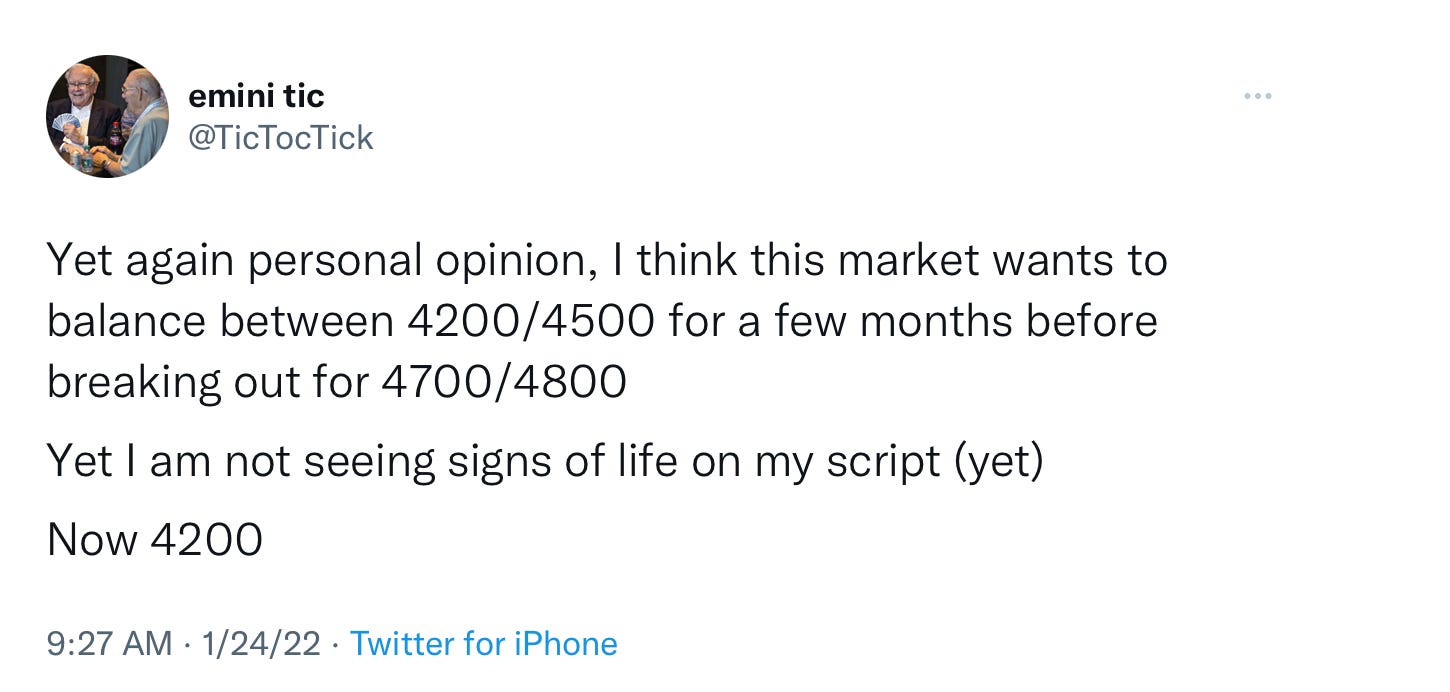
Personally I was not able to trade the morning session today due to an emergency , however I was back at my desk around 10 when I sent this tweet at 4210.
For me the confirmation was when $NQ crossed back above 14200 and the Indicator I shared started advancing rapidly from session lows.
This was pretty much the low of the day. Sharp rally sent us flying to close the day above 4400.
Many of the stocks saw levels which I was expecting for many weeks now with TSLA touching 865 , GOOG seeing 2500, AMZN seeing 2700 before sharp rallies in almost all of them.
Link to my Weekly Plan for Review
What next? Is this it and do I think is the sell over?
If you read my blog, you probably already know my opinion that I think the markets are probably headed higher into 4700 after balancing between 4200/4300/4500 for a bit. In my current thinking, a retest of 4700/4763 may decide next course of markets over the remainder of the year. BUT not without significant VOLATILITY to get there.
Now will we get there in a straight line? I don’t know. I don’t think so.
What I do know is the volatility may persist for few more sessions. For anyone expecting to make a quick buck out of these bipolar markets, I think it’s not gonna get any easier in next week or two. It’s just the nature of these moves. We are seeing 200-250 point round trip moves in a single session. By any measure, this is extreme volatility and no place for small accounts on shoestring margins and 2 point stops.
Let us review a few momentum darling charts to see what may be up with them. TSLA first..
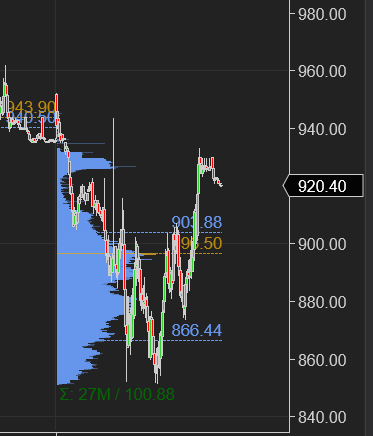
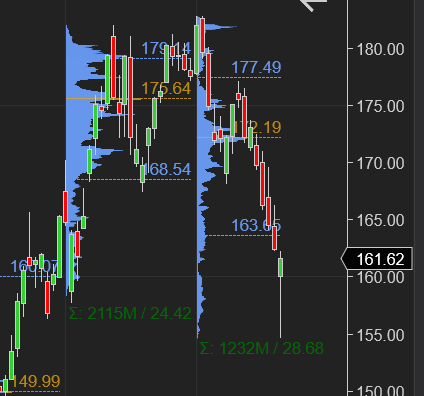
TSLA had a remarkable volume day , trading 27 million shares and traded 865 and 899 to close above 930. To compare, TSLA traded 58 million shares ALL off last week.
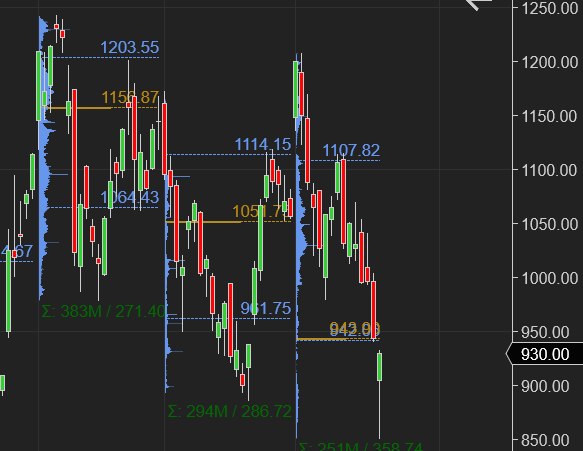
Longer term auction in TSLA below, it failed to close under a long term demand zone.
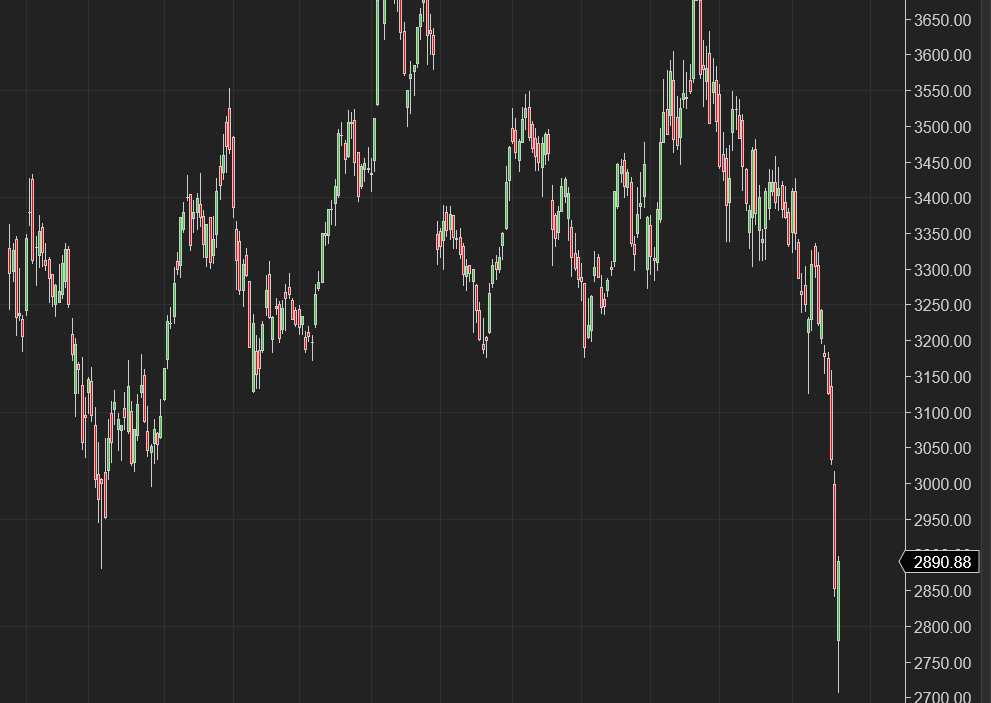
I see this pattern repeat in other names.. AAPL for instance
Last but not the least here is an Auction in AMZN
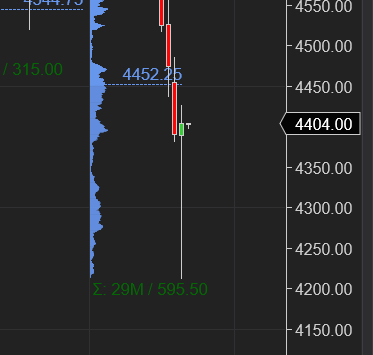
Looking at Emini S&P500 itself, I see an ULTRA high volume, ULTRA high range bar:
When looking at all of these charts together, to me they indicate two things:
Demand is not completely dead yet at these levels , bottom sniffers , guys who think they know something are probably active here
Current volatility may not be over any time soon but going lower may be harder than it has been through last 3 weeks .. not saying won’t go lower, but may be harder now..
Now when I zoom into lower time frame charts, I begin to see some clues which may help me with forming some price scenarios for tomorrow:
This was one of the MOST volume days, dating back to the volatility in 2020 , both during the onset of pandemic as well as the election night.
We closed above previous weekly low ~ 4380 at 4404
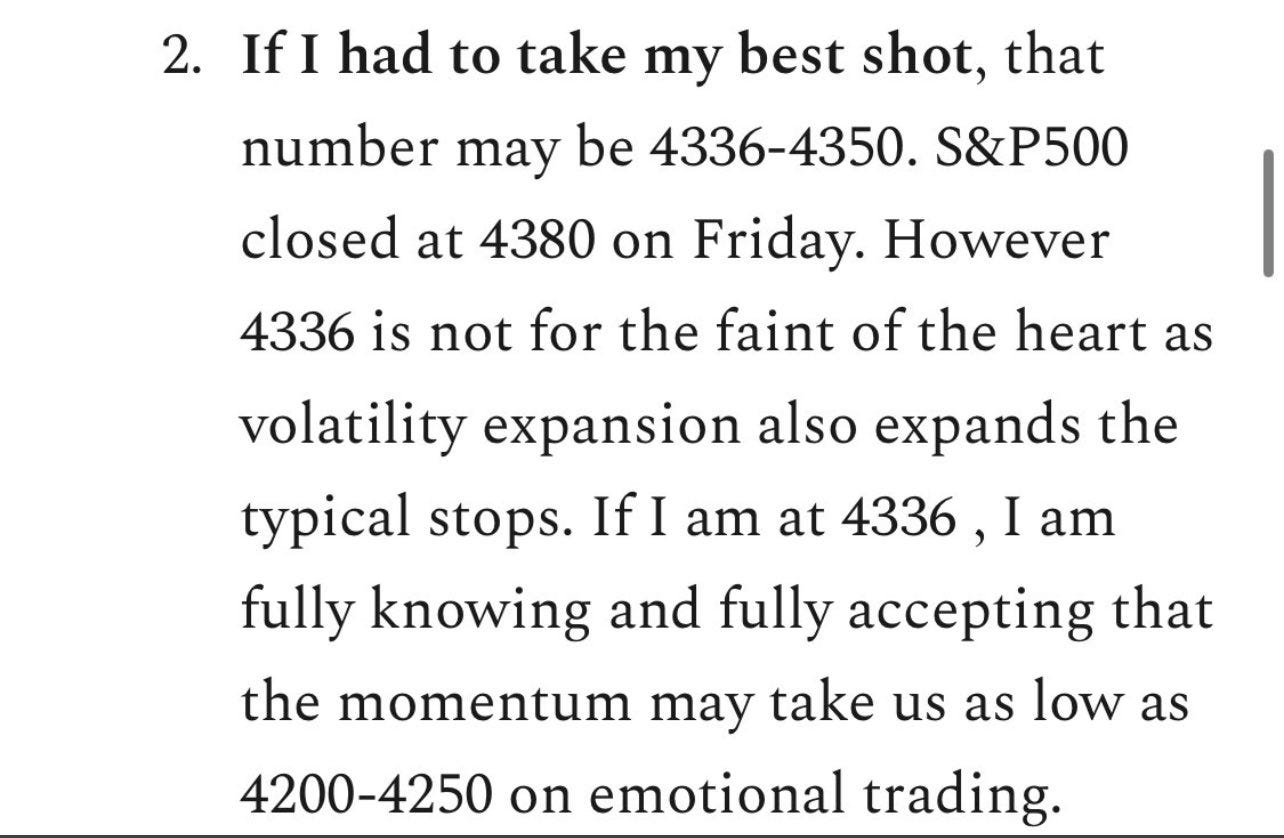
Market was willing to go lower than 4336 to explore what is “out there” at 4200!
BTW if we close back above 4500 this week, I will share in my weekend newsletter what I saw at 4200/4300 that made me go bullish.
With this context and background , here is my thinking and some price levels I will be watching tomorrow. This is how I am personally preparing for the day tomorrow with 3 key distinct zones IMO:
I think the whole 4336-4380 zone becomes meaningful tomorrow where if we open between this range, there may be good odds to test the lower end and see if it holds. This may be the balanced day type scene with 4336 on lower end and 4380 on the upper end of the range.
If we open or start trading below 4336, especially within IB, this is the scenario that may cause some volatility with my LIS being 4271 which I expect may bring in some bids. A daily close below 4270 tomorrow may be a bearish event and I think that is something that ruins the effort bulls did today.
A tertiary scenario may be an OPEN which is above 4380 which also manages to remain above 4380 in the IB period, this scenario targets 4416/4423.
At time of this blog, S&P500 emini bid 4404.
Remember these are just hypothetical scenarios based on past tape reading and order flow and any updates to these may be shared on my Twitter and Telegram. So stay tuned!
I always confirm price levels with these 2 things :
a) What are my internals doing ? See this post : Internal Magic
b) What is my TOP 5 doing ? See this for more context : Tic TOP Indicator
To Summarize:
I expected sharp rally today and got one but was quite volatile all through the day.
I do not think the current bout of volatility is over. I do think a 2nd day like today with strong volume and the market ideally closing above prior week’s lows at 4380 may lead to a test of 4500/4525 to decide next steps there.
A daily close this week below 4271 may bring more volatility and will not be personally a favored scenario for me as far as keeping the bullish narrative alive goes.
This extends to individual names as well such as TSLA and AMZN. I do think they may revisit the VAL and VAH from the sessions today to firm up later in the week or early next week.
Good Luck and Stay Safe out there! Join my email list for free to get up to 5 similar posts every week.
~ Tic
Disclaimer: This newsletter is not trading or investment advice, but for general informational purposes only. This newsletter represents my personal opinions which I am sharing publicly as my personal blog. Futures, stocks, bonds trading of any kind involves a lot of risk. No guarantee of any profit whatsoever is made. In fact, you may lose everything you have. So be very careful. I guarantee no profit whatsoever, You assume the entire cost and risk of any trading or investing activities you choose to undertake. You are solely responsible for making your own investment decisions. Owners/authors of this newsletter, its representatives, its principals, its moderators and its members, are NOT registered as securities broker-dealers or investment advisors either with the U.S. Securities and Exchange Commission, CFTC or with any other securities/regulatory authority. Consult with a registered investment advisor, broker-dealer, and/or financial advisor. Reading and using this newsletter or any of my publications, you are agreeing to these terms. Any screenshots used here are the courtesy of Ninja Trader, Think or Swim and/or Jigsaw. I am just an end user, they own all copyrights to their products.


Loving the top tic 5 indicator. Thanks for that. Hope the dog is doing better tonight
Your “sellers?” Post around 4388 was very useful and timely. Thank you