

Sell off to resume
Weekly Plan 8.11.24

Hey traders-
The key level last week was 5330, which if broken, I expected strong support to come in at 5200-5250.
This support was no match for the marauding hoard of panicked sellers on Sunday night and Monday AM, when we not only traded 5250, but also went down as low as almost 5100, having carved out that weekly low near 5130.
VIX spiked to the highest levels seen in decades, and peaked near 65. This spurred calls by several influential figures like the former treasury secretary Summers, calling for an SEC investigation into the VIX spike.
This is a thing now in 2024- when things do not go our way, when something does not make sense to us, it must be some sort of a conspiracy. It must be investigated because we can never be wrong- so if we do end up on wrong side of the tape, it must be a conspiracy by someone else and needs to be investigated. Such are the times. What can you do about it.
Welcome to another weekly installment of this blog where I share my views on which levels may hold and which may fold in the short term and some long term themes which may develop into trends, hopefully in our favor. This is going to be a slightly abridged post as I hit the road winding down into dog days of Summer.
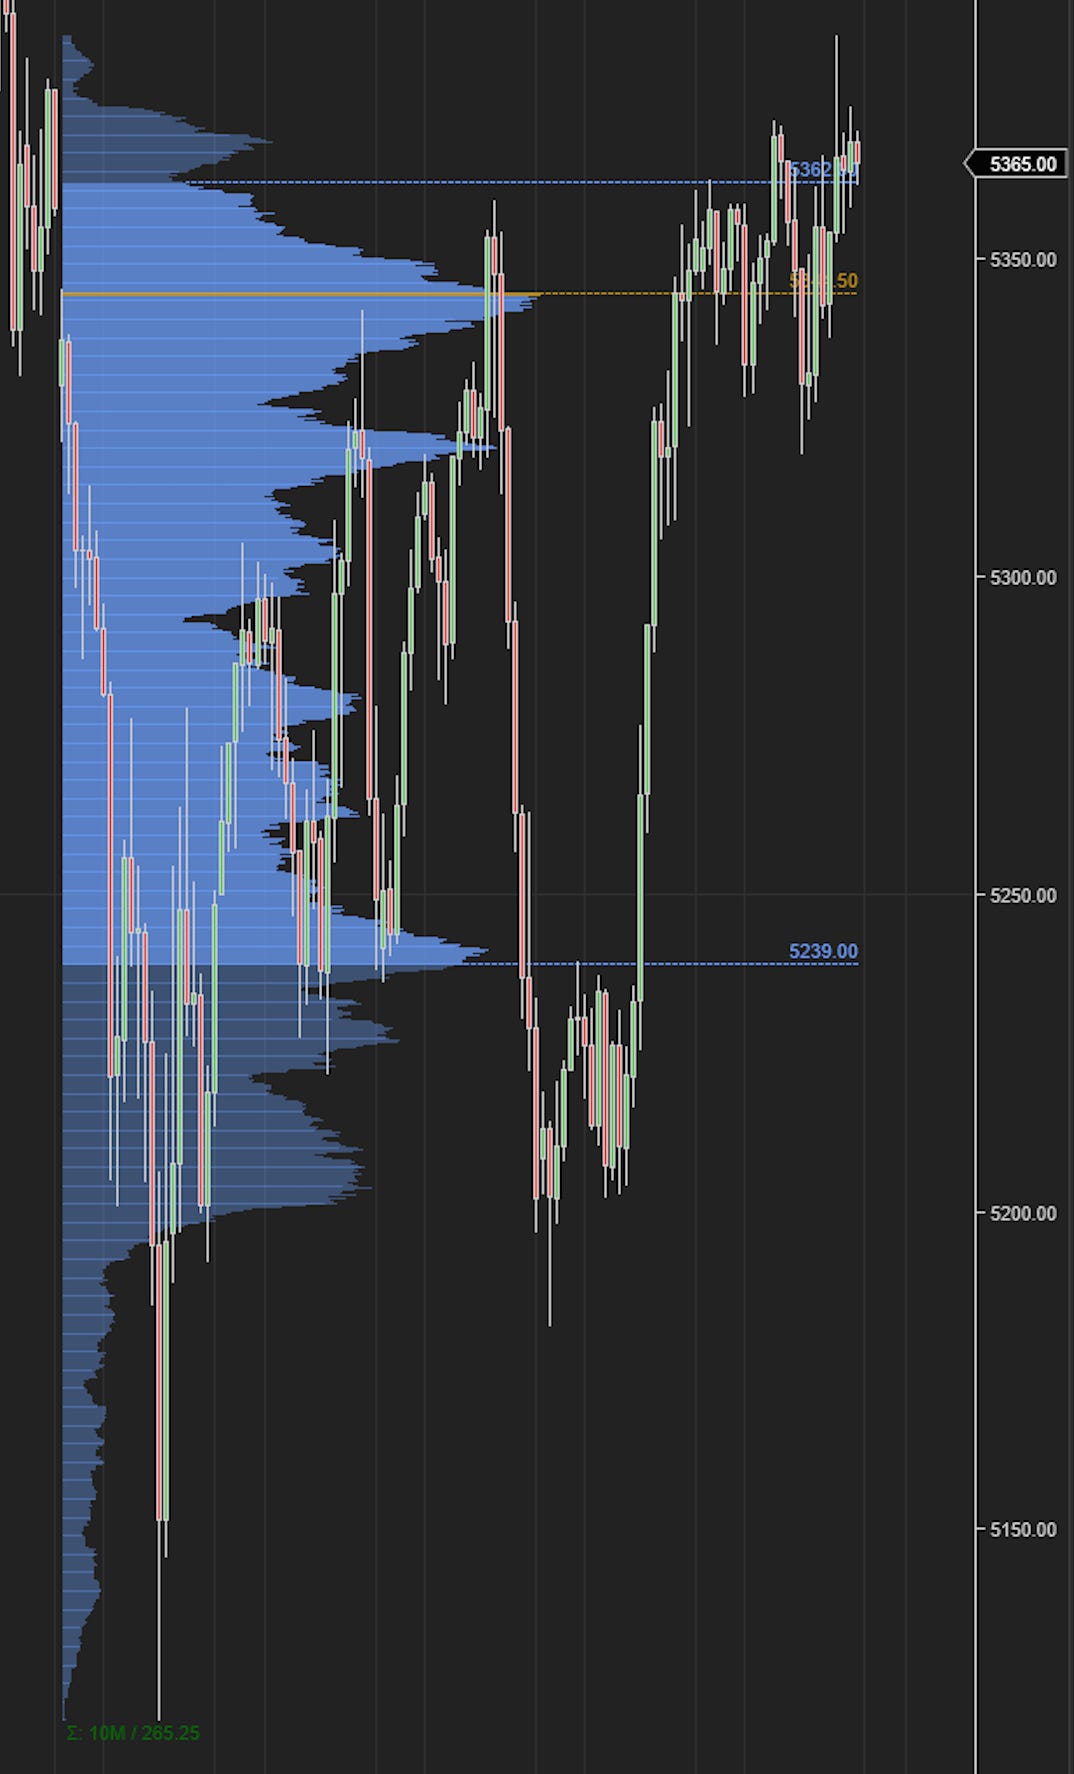
Look at Chart A above. This is the emini weekly auction. In auction terms, this is a fairly robust auction. And the edges of this range may be at play this week as well.
You can see what a sharp rejection sub 5200 which BTW was our key substack support level going several days now. The market did not like to do any trading here below 5200 at all- and sharply carved out a High Volume Node aka an HVN at 5200-5380 area. While this is still kind of in the realm of macrostructure or technical structure view of the markets, this type of analysis does offer some great clues into the potential support and resistance for these markets.
I personally am big into the microstructure side of the house- in a microstructure driven approach, you are down to the depth of market, time and sales, pace of tape, bid-ask spread etc- these concepts while still can be called technical analysis, they are more in direct relationship with the market. In a sense, when you are trading off a price ladder or a depth of market, you are communicating directly with the market. Or with the exchange itself- a level 2 represents application layer of the market in real time. There is little to no lags. Yes a few milliseconds, but you are not going to catch that with the natural refresh rate of your eyesight anyways.
Now contrast this with charts and indicators on intraday time frames- a clever trader can make them potent, but at a basic level, they are secondary tools. There are now more layers between you and the raw market. Nothing wrong with it, it is just different- in some cases, that may be better I guess. So if we are moving 40 points in a 20 seconds, I guess a chart can be more useful sometimes compared to a level 2 which has very little if any liquidity. Level 2 is objectively better in slower moving markets in my view. This is why most bond traders, will only use level 2 and nothing else as they move excruciatingly slow and can offer a better edge.
Speaking of the speed of markets or volatility, most of our readers tend to be more experienced traders but we do have newer folks as well. Volatility can be a double edged sword. If you are experienced, I firmly believe volatility will benefit you. This is why you see profits of firms such as Goldman and CME surge during such volatile times. Their traders make more money when VIX is higher.
If you are super new, I think volatility is bad for you. Now at times I do get feedback to the effect of sharing real time trades in substack. This is fallacious ask at a couple of levels - first off, I do share specific calls and puts when it makes sense for them.
This includes the expiry date and strike as well as premium. Do I do it every day? Is there an edge every day? No.
Now second off, I do not mind sharing specific trades when it comes to the futures side of the house- but it is not possible to do so when we have large platform like X or even this. If I ever decide to do that, it must be with a very small group. I am talking no more than a dozen or two dozen folks. Anything larger than that can begin to skew the order book in a way that makes it ripe for manipulation by other traders. Let us assume 1% of 200000 folks are future traders. That is 2000 folks. Let us say they all place one lot order at a key level. Now you have 2000 lots sitting at one level. One best of the days, available liquidity at any level is no more than 2000 lots. Now you see how we have skewed the depth of the market? Making it an easy target for manipulation. Thus by sharing this simple example I have demonstrated how me sharing a trade like “I buy at 5323 with a 4 point stop loss” is an extremely bad idea as I will almost certainly be stopped out.
I think the only way to do that is thru a screen cast as I may scratch a lot of trades (break even), get out for a point or two loss if I see something develop adversely on the tape and so on- I do not think you can type and send this type of information in real time. For what it is worth however, my key levels tend to be great support and resistance on most days, if not all. I have also shared my boiler plate risk strategy which is to say in intraday time frames, I think more than 10-15% of the average daily move as a risk is counter productive. So on a 40 dollar range day, what does that look like? 5-6 points max for me personally.
At end of the day, this publication cost for subs is about a dollar a day. I think it is extremely attractively priced for what it is- options, futures, stocks, bonds, gold, crypto, forex, and to top it off a free real time chat room. Now on Friday, what was so wrong about that 5323? On Thursday, what was so wrong about that 5256? So I would suggest we all focus on the key price levels I share rather than conflate execution with levels. Execution is very personal and I do not think you can copy paste it from anyone- it must be built from ground up, and it must be developed over a number of months if not years. Again, I am not minimizing this sentiment, I am simply sharing a realistic goal or a process that you as a trader have to go thru to extract money out of this market consistently every day. It cannot be given by me or by Warren Buffett or Paul Tudor Jones, it has to be learned and developed. Having good levels is a massive head start - so instead of focussing on noise, you can focus on key levels and learn from how the market interacts when it gets to those levels.
Levels for next week
So for next week, as far as risk goes, it is going to come from the PPI and CPI numbers. I think the market action will remain dependent on action in the US dollar and specifically on USDJPY. A lot of folks are still short JPY and long US Dollar denominated assets even now, and I think it will take may be another month or two to iron the fluff out. I do not think we are in proper bear market yet but I do think if Yen shorts begin to see another bout of Yen strength, they will be forced to liquidate more, causing more sell off in the US stocks.
Then you also have the US elections which are now weeks away- from a Trump perspective, softer markets are better. From a Harris, point of view, lower volatility is better.
With this said, I generally want to be bullish on good US data which is good PPI and CPI numbers- remember inflation in the US is good for US companies- they get to charge more for products and services. Conversely, bad US data is bad dollar and good for Yen.
With this said, I want to focus on that 5220-5240 area for next week. On the top side, I want to remain focused on that 5450 zone.
Scenario 1: As long as we hold 5450, I think we are headed down into 5320s. However I do not want to see a daily close above 5450 which then builds on this momentum. We are 5370 at time of this post.
Scenario 2: If we are sold down into 5220-5240s, I think this could come in as support for a move back into 5330-5350s.
To summarize: I see potential support at 5220-5240 and see some resistance at 5450, if tested.
These are weekly time frames levels and I will be sharing intraday levels in Daily Plan and/or chat below. I see this market balance out here near the vicinity of this week’s range before a push higher into 5450s as long as we do not simply collapse below 5190-5200 now. This whole process will take about a month or so in my view.
Now outside of this, if you think non linearly, there are 10 weeks left between now and the 2024 Presidential elections. Election night will be lit as far as the futures go. Let us say for a moment that we are unable to take out 5450 on the upside now. Let us say we spend days and weeks here now below 5450, may be even closer to 5200s. This blog is all about being prepared. Come election night, we are trading 4800, let us just assume for sake of a thought exercise.
Do we panic sell or we buy here?
America, despite its current issues, is the most exceptional country I know of. Nothing close to it in terms of several things- ease of business, entrepreneurship, basic human freedoms- this is bastion of everything commerce. Yes there are reasons to be worried, but where else will you go if you think America is finished? This is why if we get to 4700-4800 range, I am not saying we will, I am saying if we do, I think this could an excellent buy opportunity for a 1000 dollar move in the S&P500. On the Nasdaq side, take NQ for instance, if we get to 15500-16000 handles, I am expecting a 5000 dollar move. To the upside. Again, I am parking this for now. When everyone else is losing their minds, at 4800, I will be buying. Now many may say “ohh it’s not possible”. Remember these are the same people who questioned me early July when I said S&P500 has peaked at 5720. In less than 4 weeks we will shed more than 600 points. So anything is possible in markets, I never say never.

Other stuff on my radar
Now in my previous weekly newsletters I did state that if we do trade 5250s, even though we found a bounce here, I think this is a longer term bearish theme. Else why would you go down to 5250?
A driver of this could be the rotation. I think you can objectively argue that there has been strong rotation from big tech into smaller value plays and smaller caps in last one month or so. Usually these are not short term moves. We saw this in late 2021 and early 2022. So I do not want to downplay this and I think this thing could have legs.
This is why I do believe that this is a stock picker’s market and we may be past an era where everything goes up at the same time. In this sense, I do still think that value type names, smaller caps could do better in next weeks and months ahead, compared to their extremely big tech counterparts. This is not a new position, I have been rattling this off since late June and I have stayed away for most part from big tech with few exceptions- like NVDA at 96, AMZN at 150s, TSLA and AAPL at 208. This is not going to change this week either unless I see specific indicators that support vigor to be back in these big tech names. We can all agree on that a vast majority of retails and funds are heavily long into big tech. While move is barely 10% from the highs, it is still 10% of the highs, it is not a small move. So whatever caused it, there may be more to it. This is why I am not too excited on these big techs here in August but that will have to change at a later point. Just not today.
Pilgrim’s Pride
PPC. The second largest processed chicken food manufacturer here in the US with substantial presence in the UK as well. It is 44 and change at the moment but I like this technical action here right above 40.
This sort of action extends to similar stocks like TSN, but Tyson has its own issues other than the technicals. I have been a Tyson bull from around 50 dollars where I shared the bottom a few months ago here- I do think as we start getting softer on the consumer side, it should impact some of the dining table habits and wean folks away from pricier cuts of beef into more economical chicken and other meats. This could be a plus for these stocks. I see PPC push higher into 57-60 dollar area as long as we hold recent lows near 39-40.
TTD
TTD is another Substack stock I called bottom near 60 dollars a few weeks ago. This stock languished for a while before now breaking out and is now trading near 100.
I do like the action here at 100. I do like to see the general market stabilize a bit, however, I do think if this pulls into 90-95 and is supported there, it may make a push higher from here to new highs near 110.
While you can’t really call them small caps, these stocks, like TTD, PLTR etc have shown resilience in face of this recent meltdown.
I think one reason is that exposure to these stocks has been lower than compared to NVDA, MSFT of the world. Then you also have some other factors working in their favor.
PLTR is sort of in the same spot. If you recall I had called 22-24 as a key support in PLTR if tested.
This was tested this last week and the bounce was quite swift and brutal. This is why if you follow a certain market, I always mark down these levels somewhere, as I cannot rehash every idea again and again every single week but the levels remain in play.
Now with PLTR, I do also see this as a war stock, but not a legacy war stock like an RTX or LMT. I will move my key LIS on this now to 26.
I think if 26 holds, we should see PLTR push above 35 area.
ENPH
This is another substack stock with LIS at 90 dollars and I think it has behaved quite well under current market duress.
NVDA shed near 20% this month alone. ENPH? A 3%. Not too shabby. Regardless the key LIS on this will be 90. This is an extremely volatile stock though. This stock also benefits from resurgence and revival of the Harris campaign. I am a long term ENPH bull. I do think that here at least in the US, there will be large disruptions in traditional grid supplied power- there has been an underinvestment in grid, power plants are aging, electricity distributors like PG&E and Oncor are raising prices like there is no tomorrow and add climate related disruptions which can only get worse- these factors are motivators for households as well as businesses to consider a secondary power source and in many cases it could be secondary generators or battery storage. These are all tailwinds for companies such as Enphase.
MSTR
I have had some good calls both bullish and bearish on MSTR recently and with this sort of stock, I like it near 100 dollar area. Especially if we see Dollar gain, I think it is negative for MSTR. It is now 135 though. I do not have an intermediate term view on MSTR, though I think if you zoom out to January 2025, I like the 150 or so call on this. It is bid at 30 dollars at the moment and I think if this pulls back into 15-18 dollar range, this makes this call quite attractive for me.
Gold
With respect to Gold, I was perhaps one of the very early bulls when it was at 1600. In terms of relative speed of gain, I think Gold has had an excellent run from that 1600 to 2500. This is almost a 35% gain and has come at a breakneck speed. So no surprise that Gold in recent weeks has been balancing out here.
Gold for me is an asymmetric idea. I have been buying gold when it was 200-300. It’s not something you trade. It is something you posses. Now I am not saying I put everything that I have in Gold. Far from it. But I personally have 2% or so threshold for exposure to Gold. Again this is not specifically for some miners or stocks, but physically which can then be stored in some vault somewhere a mile under the Blue-ridge.
Look the prevalent thought now is that the FED will cut soon, there will be another QE soon and the dollar will collapse and stocks will moon. Which may be the case, in particular I think there is a high chance that the FED does some QE again and our national debt reaches 50 trillions dollars here in the US. However, as contrarian my view is that Dollar is not exhibiting classic signs of duress at the moment. Normally I like to see a much more vigorous sell off in Gold and Dollar, based on recent weak data out of the US. This tells me there is pent up demand for the US dollars. Now the reasons for this could be extremely bad- it could be some impending geopolitics drama in months ahead. The bottomline is I do not see Dollar give up this 100 easily. If true, and if Dollar retraces to 105-106, I think this could help both Gold and Dollar bulls.
My long term target on Gold is 5000 dollars. Once it gets to 5000, I think it will carve out a multi decade range between 4000-5000. May be this range will outlive most of us. This is why Gold is a buy for me on dips. I really do not have a Line in Sand of Gold because having a LIS denotes I will sell my gold and I will never sell my Gold. As simple as that. You have to view all these markets in context on 100-200 year plus historic timelines. Stocks tend to have short life span. May be some good stocks have a 20-30 year life. But most stocks will perish over time.
These markets in Gold, Copper, Silver, Oil (energy) for that matter are have a lifespan of 1000s of years. Do not ignore these markets as part of your routine analysis and checklists.
Have a great week ahead. Subscribe now for real time cutting edge ideas. Don’t get left in the cold when markets make huge moves.
~ toc
Disclaimer: This newsletter is not trading or investment advice but for general informational purposes only. This newsletter represents my personal opinions which I am sharing publicly as my personal blog. Futures, stocks, and bonds trading of any kind involves a lot of risk. No guarantee of any profit whatsoever is made. In fact, you may lose everything you have. So be very careful. I guarantee no profit whatsoever, You assume the entire cost and risk of any trading or investing activities you choose to undertake. You are solely responsible for making your own investment decisions. Owners/authors of this newsletter, its representatives, its principals, its moderators, and its members, are NOT registered as securities broker-dealers or investment advisors either with the U.S. Securities and Exchange Commission, CFTC, or with any other securities/regulatory authority. Consult with a registered investment advisor, broker-dealer, and/or financial advisor. By reading and using this newsletter or any of my publications, you are agreeing to these terms. Any screenshots used here are courtesy of Ninja Trader, FinViz, Think or Swim, and/or Jigsaw. I am just an end user with no affiliations with them. Information and quotes shared in this blog can be 100% wrong. Markets are risky and can go to 0 at any time. Furthermore, you will not share or copy any content in this blog as it is the authors’ IP. By reading this blog, you accept these terms of conditions and acknowledge I am sharing this blog as my personal trading journal, nothing more.