Folks-
I want to talk about the pivotal move and how to measure it.
I am a momentum trader. I create and use tools to measure and trade this momentum. This post is in addition to my precious work on Momentum. Click on this link to read all about it.
Price action traders, which I am, rely on the pivotal move to identify when a change in primary trend may have occurred. However, many times the pivotal move can be fake due to news or events or some other factor not related to the underlying supply and demand.
I would not go into the weeds of a pivotal move as that is a separate post altogether, but think of this closest in analogy to the Great Jesse Livermore’s Pivotal point.
A pivotal move is when a departure from the norm has happened. This norm may be an uptrend, a downstream, it could be when the accumulation phase has finished.
As I said this will be a separate post altogether with some recent examples.
Subscribe now to get real time alerts whenever I post a new tool or indicator.
However for now, I want to focus on how to confirm if the Pivotal move is legit or a fake-out.
There are several ways this can be done. I prefer to use a simple Rate of Change indicator. This indicator is available on many platforms. If you do not have, you can code it your self , so fairly straightforward.
At it’s core, Rate of Change or ROC is a momentum tool and measures the delta between now and a certain amount of time ago.
Here is the math behind this tool:
ROC=(Close Price −Close Pricen)/Close Pricen×100
Where Close Price = Current Closing price
Close Pricen = Closing price n periods ago
I use this in 3 main ways:
As long as this remains above 0, I remain bullish, unless I see a deviation between the indicator and price
As long as this remains below 0, I favor bearish bets.
If this starts clinging to 0 without making any extreme reads, I am on lookout for a major move coming out of that compression.
Let us look at some examples:
XOM
XOM has been on an uptrend of late. This is evident by the Rate of Change tool. Chart A below. On a pullback XOM consolidates and resumes it’s upward journey.
Chart A:
A. XOM dips and finds buyer as the ROC makes new lows (0 line)..
B. XOM makes new highs, YET ROC does not. XOM Falls.
C. XOM has again made new highs but the ROC has not caught up. Could it be setting up for a fall? If so, 80 is key!
ARKK
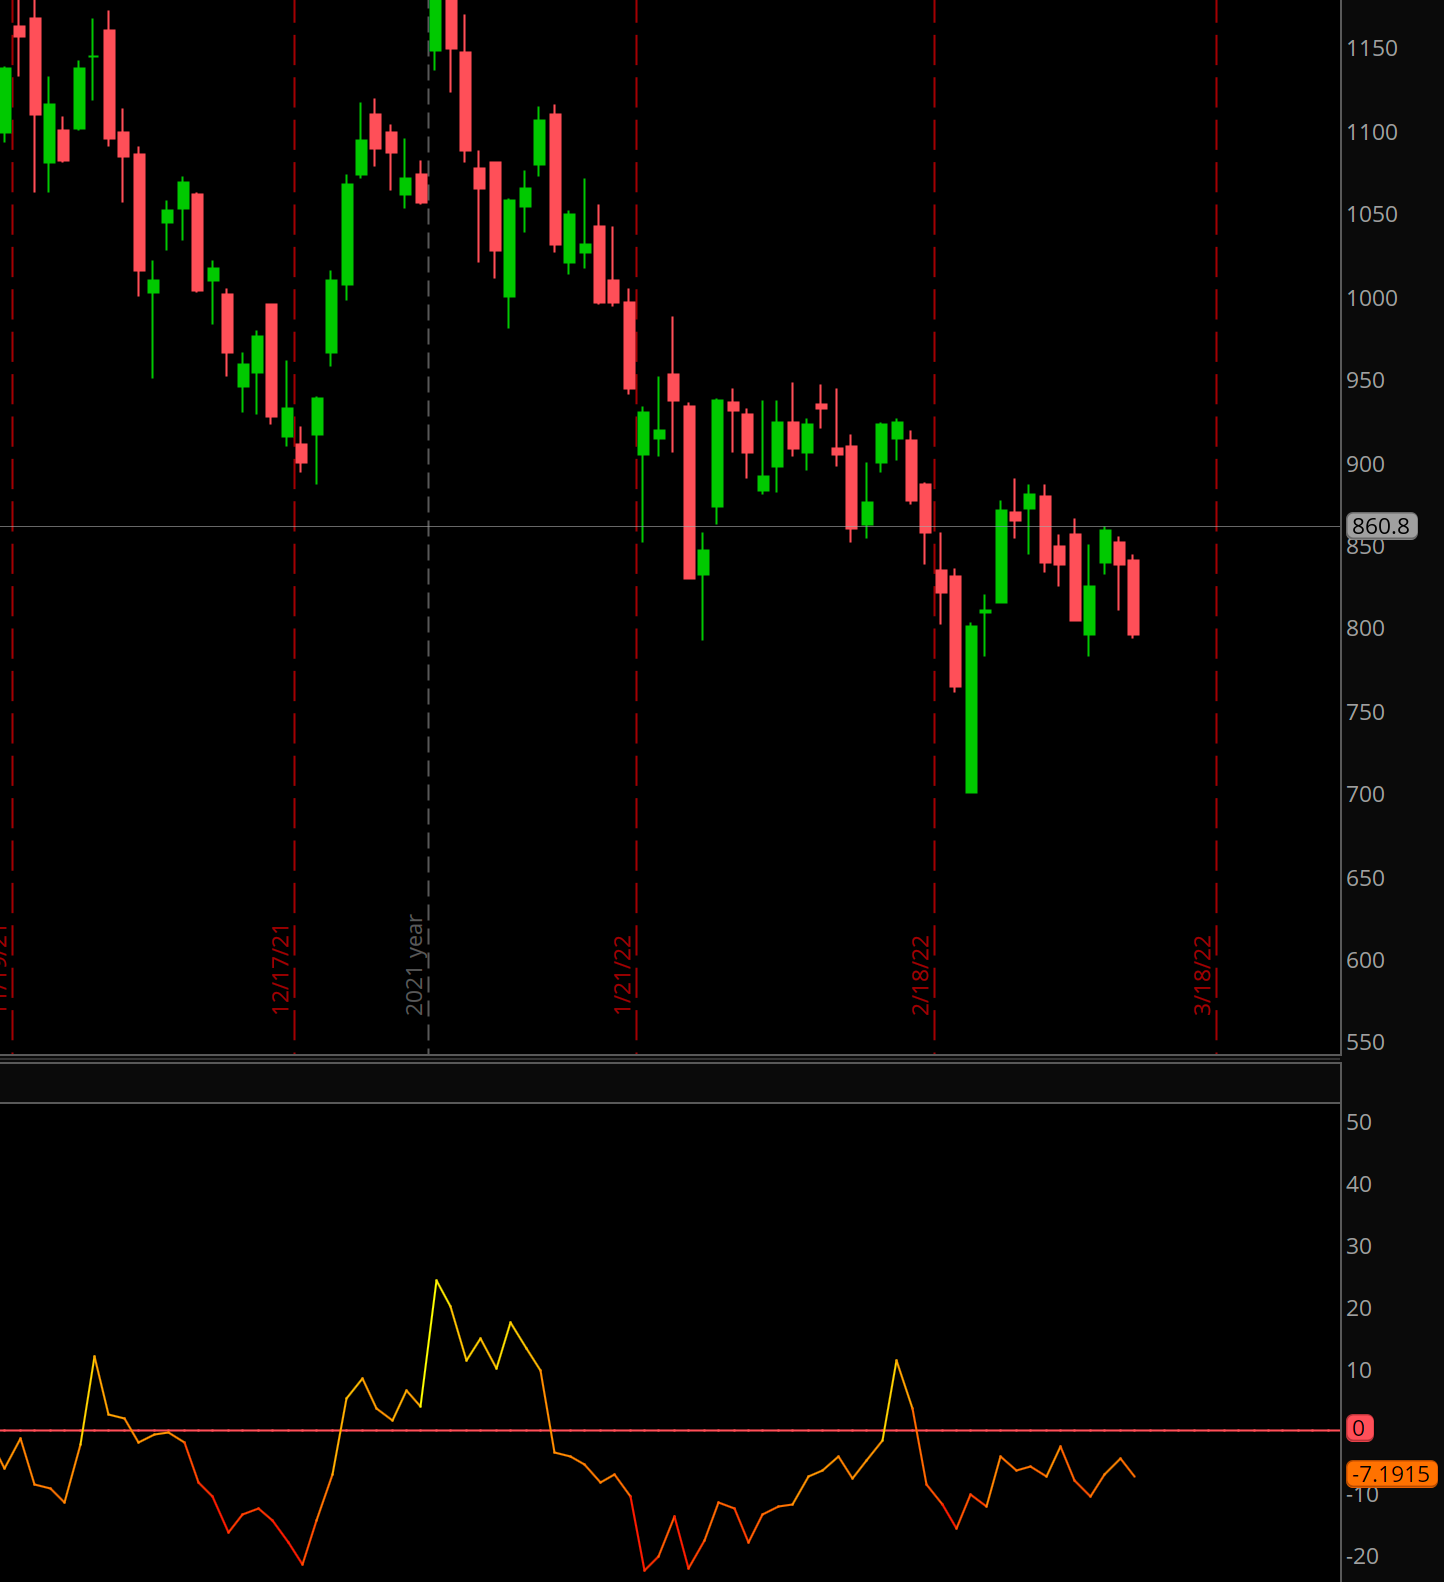
ARKK remains in a downtrend and any retraces to 0 line have been sold. Chart B .
I think ARKK could firm up once ROC climbs back above 0, starts trending upward.
TSLA
Recent weakness in TSLA can be confirmed on the ROC tool. However, even as TSLA makes new lows, ROC does not. Stays flat. Could it be predicting a rip in TSLA? Confirm with a close above 899.
OIL
An example of Pivotal move that needs confirmation, Oil had been in constant uptrend for last several months before abruptly jumping almost 20% in a matter of days. This is an example of a Pivotal move. However, there are two outcomes which can occur here:
Steady uptrend resumes taking Crude Oil back above 130 to new highs at 150
A decline begins with Oil breaking 100 and back down to 80
Either way, we know in the backdrop there is a Pivotal move. However, it needs to be confirmed with Oil closing below or remaining above the key orderflow level 108 .
Chart D:
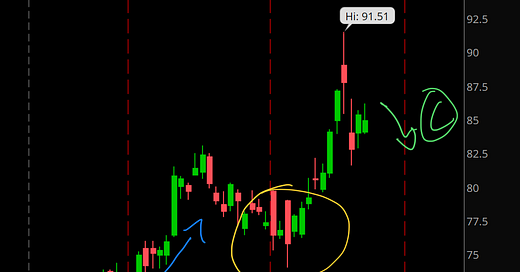
A. A Pivotal move has happened in Oil with a large move outside of recent standard deviation. Will OIL now start crashing ? Or will we resume uptrend? Comes down to 108 and what occurs next in ROC. Will it start trending below the 0 line?
You can see this on play on many tickers. Don’t get me started on PayPal or Meta FB 😉
Like all tools that I share, this one works in a specific set of market conditions. Which are now. As the market regimes change, so must our tools. Join Substack today and stay on top of whenever I post a new tool or indicator.
Share the post with other momentum traders, like your self.
~ Tic 🍀
Disclaimer: This newsletter is not trading or investment advice, but for general informational purposes only. This newsletter represents my personal opinions which I am sharing publicly as my personal blog. Futures, stocks, bonds trading of any kind involves a lot of risk. No guarantee of any profit whatsoever is made. In fact, you may lose everything you have. So be very careful. I guarantee no profit whatsoever, You assume the entire cost and risk of any trading or investing activities you choose to undertake. You are solely responsible for making your own investment decisions. Owners/authors of this newsletter, its representatives, its principals, its moderators and its members, are NOT registered as securities broker-dealers or investment advisors either with the U.S. Securities and Exchange Commission, CFTC or with any other securities/regulatory authority. Consult with a registered investment advisor, broker-dealer, and/or financial advisor. Reading and using this newsletter or any of my publications, you are agreeing to these terms. Any screenshots used here are the courtesy of Ninja Trader, Think or Swim and/or Jigsaw. I am just an end user, they own all copyrights to their products.


