Folks-
Welcome back to another weekly educational newsletter. This is going to be an important post where we talk about some volatility concepts and a couple of high probability trade set ups. You do not want to miss this.
Above image is just a calculation of VIX but don’t worry, you do not need to solve this equation today to crack the markets. Just be aware of some simple volatility concepts which are too important to be not understood.
Before we deeper dive into this educational post where I share some high probability intraday short term trade concepts, let us do a quick review of the week that was.
The primary expectation for the week was to see sellers at 5211-5220. And see buyers come in at 5130.
On Sunday night, we rallied sharply higher from 5150s into 5211.
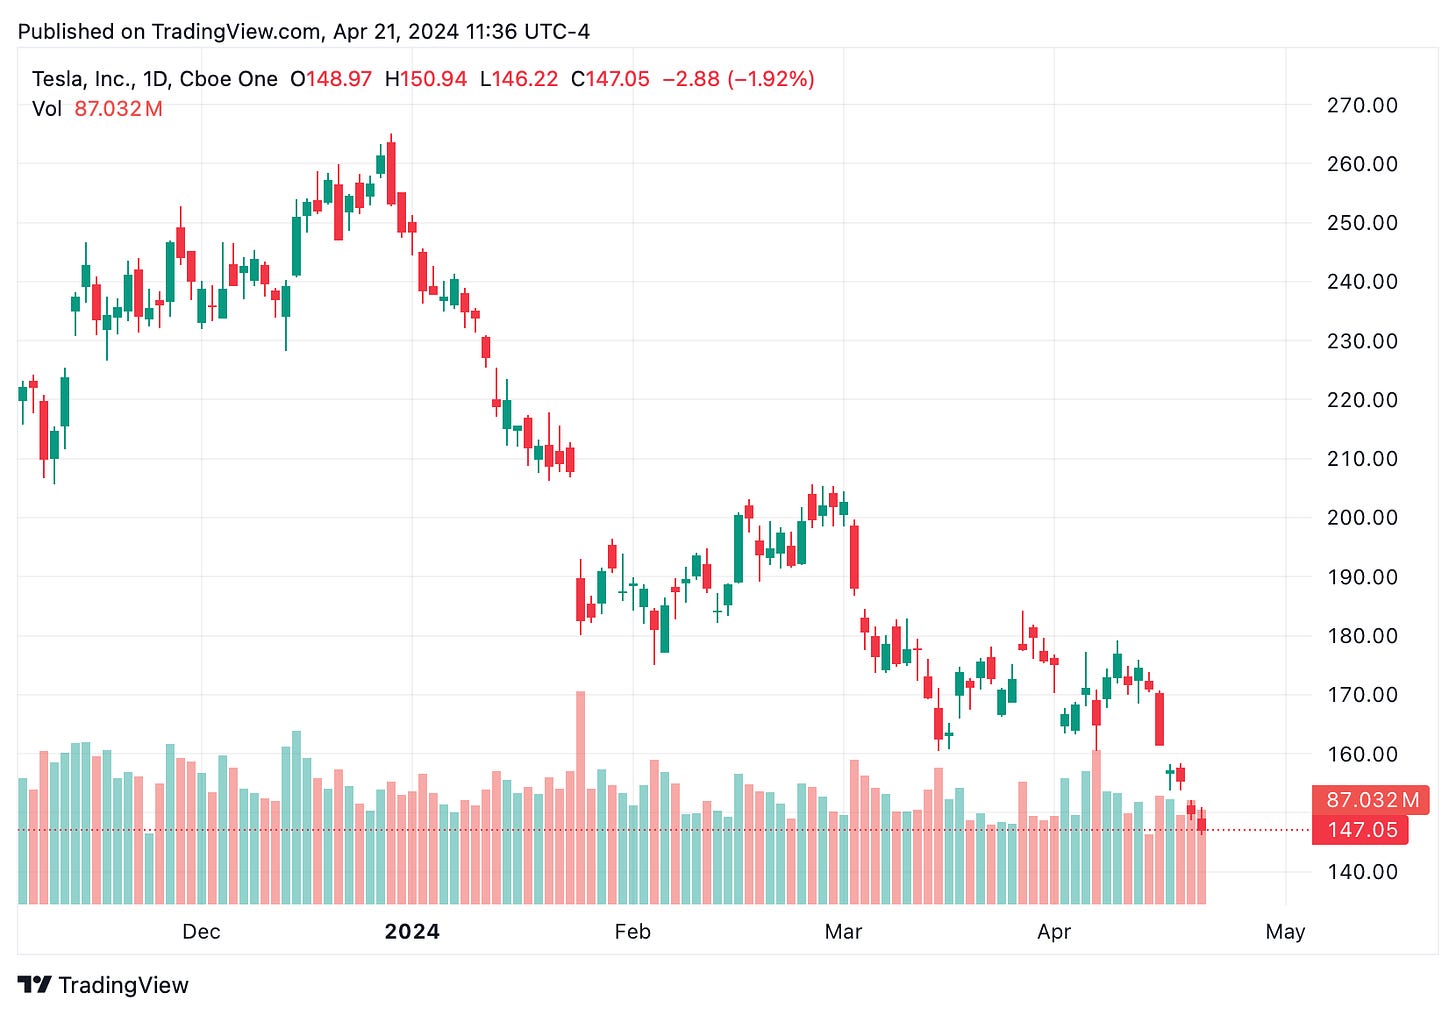
See Chart A below for Daily Auctions this week.
Exact high of the week was 5211. With a weak bounce at 5130s which then became resistance for rest of the week.
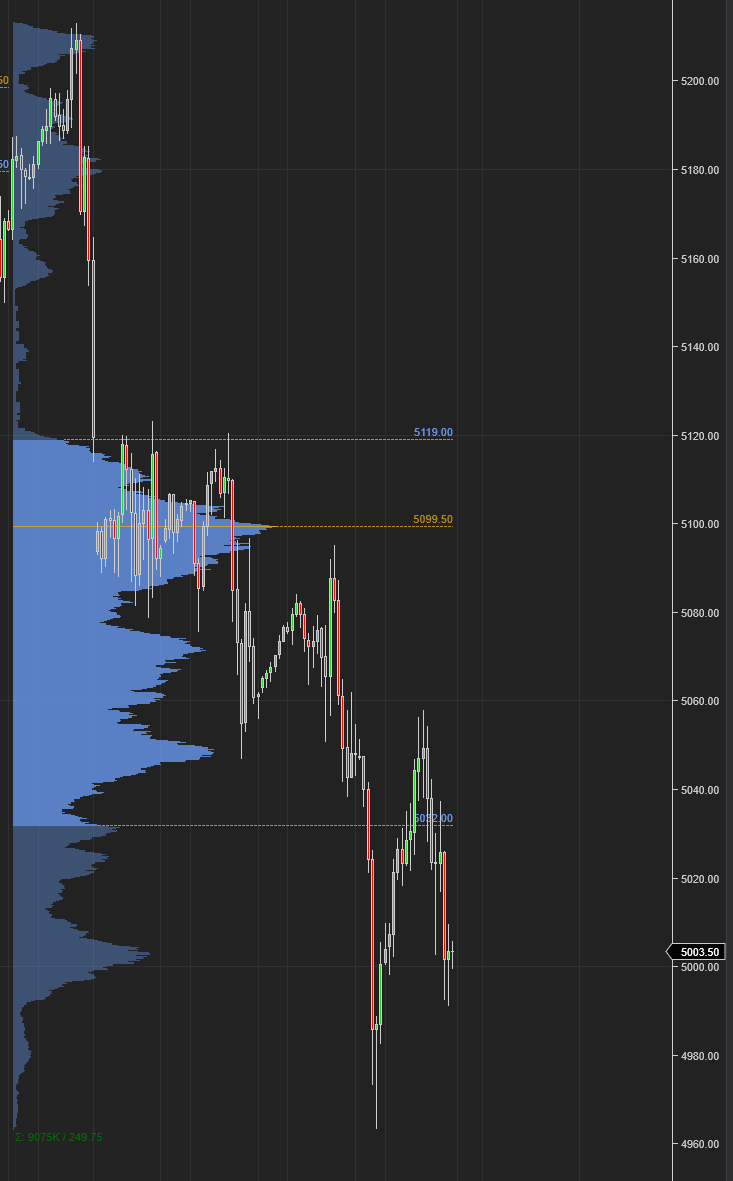
Chart B below shows the OrderFlow view of the market this week.
See that Upper Value Area high form at 5120 which presented resistance each time this level was tested, to break down below 5000 and close the week a couple of points above 5000 .
For first time in several weeks, I also shared some bearish ideas. As the market tone shifts from new highs to new lows, I will be sharing more bearish ideas than bullish ones. This is as designed. When the general index is making new highs, bearish ideas in general are low edge ideas. So I avoid them.

However, this publication is agnostic of market direction. Based on bearish or bullish conditions, I may have more bearish or bullish ideas, but it really depends on the market context.
A few of these ideas that worked well are listed below. All shared in last 2 weeks or so:
MSTR bearish call from 1500 to almost 1100.
ROKU bearish ideas from 64s to 56.
ARKK bearish view from 50 to 42.
ADBE bearish call from 480 to 460s.
NFLX earnings bearish call from 630 to 560.
AMD down from 200s to 145.
Many more.
Generally, I use a very simply screen to define and measure bearish or bullish pressure, along with orderflow and option chain metrics.
Purely technically speaking, one of my favorite strategies is to see a market make new 50 day lows, when the 50 DMA is below its 200 DMA. This is a robust strategy that can be backtested, and when used in conjunction with OrderFlow levels can yield impressive results.
Similarly on the upside, I am not interested in fading a market that is strongly up trending, meaning its 50 DMA is above its 200 DMA. A lot of funds use this same metric to measure momentum and it ends up becoming a self fulfilling prophecy.
Sprinkle in some proprietary orderflow levels as well as fundamental context, and you have a robust framework to make decisions.
So are we in bear market now?
No. Not from a purely technical context yet, but it will change rapidly. Yes, the sell off is very vicious. Nasdaq NQ futures for instance have lost about 1600 handles within less than a month from that 18500 key level which I predicted several months ago will be the high for this market. Philosophically, this is a manifestation of what I have now been saying for a while. There is not much solid ground underneath this rally which is built by FOMO and chasing mirages like AI. Stocks always go up they say. No often they do not. If Big Money sponsorship is not there, the entire thing can come crashing down like a house of cards.
However the reasons for this particular move, I suspect are not your typical bear market reasons, like recession, large scale layoffs, profit erosion etc. Whatever the reasons be, the fact remains the market has lost 350 handles in a month. So the sell off is pretty vicious. I think this has got a lot to do with a lack of bids here in this area rather than a systemic bear market. Egged on by media circus, and the so called “experts” a lot of money was poured into stocks like NVDA and SMCI at the very top near 1200 and 1000 respectively. This did not give the market a chance to build a substantial value area for these stocks. When a value area is missing, be it any stock, NVDA or SMCI, it means there are not going to be enough bids when the market moves south.
This is exactly what we are seeing in NVDA for instance now. This is a transition period where the market moves from one regime and shifts into a lower gear. These moves do not have to be one way down. Or up.
On Friday, this market fell 10%. On no news. No reason whatsoever. The stock fell 10% because another SOX stock also fell 25%. NVDA is not SMCI. SMCI is reliant on NVDA. Not the other way around.
On my part, I shared SMCI when it was 65 dollars here in the Substack. And then again when it was 250 dollars. And then again when it was 500! These levels are battle hardened levels with a lot of institutional sponsorship. But are there some funds out there which all of a sudden woke up and started buying SMCI at 1000 and 1100?
I highly doubt it.
It was your doctors, your real estate agents, who saw this as easy money to buy it at 1100! Was it too risky to buy at 250 and the risk disappeared at 1100 because every one on CNBC was also buying it? Results are for all to see.
So this is a very programmatic sell off without any reason other than the fact that these high flying stocks have no orderflow sponsorship at these levels. Once this selling exhausts, I think this market will rally again. But it may be safe to say we have put in a meaningful high now around 5211-5330 for a long time to come.
While nothing is black and white in markets, these are some of the clues you can use to gauge what the market will do next, if these levels are retested in future. I use these same exact techniques I am sharing with folks today to come up with my own levels as part of this educational blog.
With this out of the way, let us quickly review a couple of my favorite intraday short term trade setups.
Previously, in this Substack, I have discussed the importance of Tic Top Indicator, TRIN, TICK etc. This is in addition to that. Those concepts when used along with such trade setups can yield a higher probability ideas.
The primary tools we use for our study today is the OPEN which is the opening cross at 830 AM US Central Time. And a simple VWAP tool.
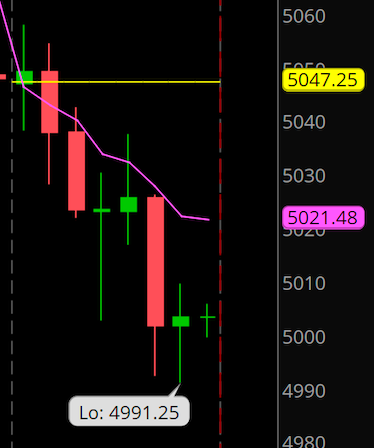
See Chart C below.
What I have on this chart is the yellow line which is the Daily OPEN and the purple line which is the Daily VWAP.
I use the VIX on top of this to get a sense of expected session range. To simplify it a bit, if VIX is down into 12-14 range, I am expecting a Daily range in the Emini or SPX of about 25 points. If VIX is now trading near 20, it means I am expecting a Daily Range of about 50 dollars on the SPX index. If VIX goes to 30-40? You can do the math.
In short, the day’s range on Emini or SPX or SPY, is a function of the price of VIX. Not always. But on most days.
Now we have 3 tools to start our hunt for a good trade set up -
We know our cash session open price.
We have added a VWAP to our charts or Price ladder.
We now have a rough sense of expected move of the instrument we are trading in.
These concepts can apply to all markets- from stocks to bonds to FX to indices but in this instance, we are focussing on the emini index.
Now in next segment I am going to drill down into how I use this information. However, as with any technique or methodology, the more people start using it, lesser its edge. As time goes on and more folks realize such price action and volume based strategies, their edge could go down. Please keep this in mind. When such a time comes, we will reformulate other strategies.
Let us first start with the opening range.
I define this as the first hour when the cash session market is opened.
The simple way I read it is that if the expected range of move is 50 points, and we have only moved 10 points in the first hour, then this means the large traders are at this point not active in this market.
Large traders = large price moves.
So with only 10 points to come in first hour of trading, it tells me there is potential for a larger move in rest of the session. It could also mean that the larger traders are just not gonna trade today- for whatever reason.
If on the other hand, the expected move is 50 dollars and the first hour move is 50 dollars, then that to me tells me from a large trader perspective and more importantly from the MM perspective, the Day’s expected move has already happened. Unless we take these extremes (low and high volatility) out, we have probably seen the high and low of the day. When later in the session, if we take out these highs or lows, those are called range extensions and they almost certainly come with greater volatility for the session. This is because now the MM have to do a bunch of work to adjust and hedge their positions as the option greeks get out of the whack.
Let us look at a couple of these setups and what high probability trade setups that could be derived-
Scenario 1: Opening range (first hour range) is less than the day’s expected move.
In this case, the scalpers are more likely to be active.
They could be picking a couple of points at the highs and a couple of points at the lows until this range breaks. If this initial range breaks on a high volume bar, where the volume is about 2X the average volume in the opening range, I favor going with this breakout higher or break lower. The other high probability setup could be to see support come in at retest of the breakout point (if breakout volume was high enough) or to see resistance come in at the break lower point. For small range days, trading the VWAP is not the best strategy in my view.
Scenario 2: Opening range is equal to or exceeds the day’s expected range.


