Traders-
Some levels, a couple of scenarios and my thoughts on action today. Enjoy :)
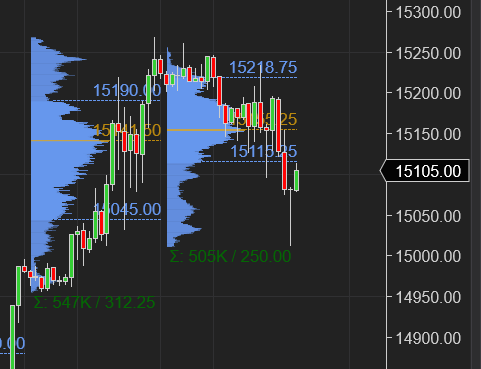
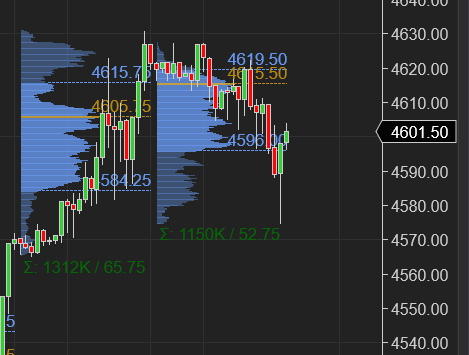
First things first, Chart A NQ and Chart B ES Daily auctions below.
Here is another look at ES..
These charts are not exactly pictures of health in my opinion. However for now we grin and grind higher. Once the lower LIS breaks, what’s below us? 4400 on ES. 14238 on NQ IMO. Now 4601 and 15200 respectively. Today was also inside days which tend to interest me a lot.
From yesterday, Scenario 1 worked out very well. I had the resistance lined at 4613/4620 with my target at 4565. High of the session was almost 4620 to the tick and missed 4565 narrowly before a sharp rally in last few minutes.
Read the plan here, if you have not.. click it
These scenarios are very time consuming for me and are a result of being glued to the tape 6 hours a day. If you like the scenarios, feel free to share my newsletter as this is what helps me get to more traders with message of the tape as I do not rely on any other means than word of mouth.
In some of my other names shared earlier, the egg stock, the big egg producer CALM did very well. I shared this around 45 and it closed at 55 today.
So coming back to Emini S&P500, these inside days tend to be a key sign of indecision and are hard to call direction. For following days, you need to pick your levels wisely, often orderflow is the only clue as there are no other signs technically.
What I do think remains in play is 4565 the low of the day as well as the session highs from today at 4620. I also thought that rally last minute was a little suspect but more on that in a bit.
Could we see another inside day before a break higher or lower? I doubt it. I think with core PCE number tomorrow and the NFP on Friday, we are going to go big one way or the other. It is also month end and quarter end, I expect fireworks.
Using this background and context, here are key scenarios for me for tomorrow:
I suspect 4588-4593 is a key zone for tomorrow. With these inside days, I get a little bit more confirmation that I may get a pullback after all into 44xx handles as I have been expecting BEFORE the next leg up.
With that said, if we open or offer below 4588-4593 , I will be watching for weakness to develop in my indicators like Tic TOP to retest the LOD at 4565. Eventually if 4565 breaks, we may test my key orderflow level at 4515. This is Scenario 1.
Scenario 2 for me will be an open or bids above 4593, which I think may lead to a test of 4620 HOD from cash session.
In my opinion IMO , for the next large (r) move , whether that is 4700 or a 4400, we need to take out 4620 and/or 4515 (on downside).
At time of this post, emini is trading at 4602.
As I said earlier, if I did nothing earlier when we had the sale on TSLA at 800 and GOOG at 2500, I can not justify myself chasing some of these levels now with TSLA at 1100 , GOOG 2850..
I will wait for S&P500 to pullback, and that may mean a TSLA at 980/1003, it may mean an AAPL at 169/172. AAPL is now at 178.
With all this, can the break out come tomorrow?
Yes it is possible as any thing is possible , however based on my methodology, these may be unfair prices and fairer prices may be on that pullback.
What else?
In my newsletter last night, I turned sour on the recent rallies in meme and really beaten down stocks like HOOD, AMC, GME etc
I turned out to be right as we had massive moves down in HOOD, down almost 10% today, AMC down about 13%, GME also down big today. I think if S&P500 softens, these stocks have more pain for them in next few sessions.
Then Home Builders index XHB which I was bearish earlier at 72 has been buried on backs of almost 5% mortgages and supply chain woes.
Chart C XHB negative momentum.
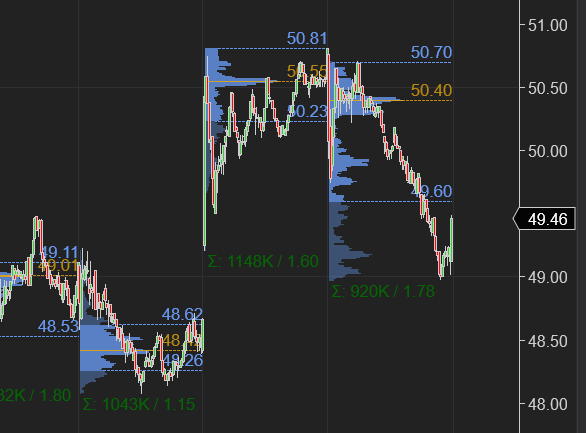
I do feel some of this is over done.. like if I look at TOL. I kind of like this as long as that gap holds at 47/48. Now 49. Chart D.
~ Tic
Disclaimer: This newsletter is not trading or investment advice, but for general informational purposes only. This newsletter represents my personal opinions which I am sharing publicly as my personal blog. Futures, stocks, bonds trading of any kind involves a lot of risk. No guarantee of any profit whatsoever is made. In fact, you may lose everything you have. So be very careful. I guarantee no profit whatsoever, You assume the entire cost and risk of any trading or investing activities you choose to undertake. You are solely responsible for making your own investment decisions. Owners/authors of this newsletter, its representatives, its principals, its moderators and its members, are NOT registered as securities broker-dealers or investment advisors either with the U.S. Securities and Exchange Commission, CFTC or with any other securities/regulatory authority. Consult with a registered investment advisor, broker-dealer, and/or financial advisor. Reading and using this newsletter or any of my publications, you are agreeing to these terms. Any screenshots used here are the courtesy of Ninja Trader, Think or Swim and/or Jigsaw. I am just an end user with no affiliations with them.


Hi there, one of the subs asked me to rewrite my version of the TicToc indicator for TradingView adjusting it to the daily time frame, you know who you are :). My initial version adapted the indicator to the current time frame so if you were on the 5 mins time frame you would see small values of the indicator as the difference would be only 5 mins. This version below calculates the difference between your current time frame and the previous close of the 5 stocks included in the indicator. "I hope" this is what Tic is seeing. I would love if some of you guys can test it can give feedback on it. Please try the code below:
// This source code is subject to the terms of the Mozilla Public License 2.0 at https://mozilla.org/MPL/2.0/
//@version=5
// @v_i_c
indicator("Percent Change Monitor", overlay=false)
currentTimeFrame = input.timeframe("","Timeframe")
stock1 = input.symbol(defval="AAPL", title="Symbol 1")
stock2 = input.symbol(defval="MSFT", title="Symbol 2")
stock3 = input.symbol(defval="AMZN", title="Symbol 3")
stock4 = input.symbol(defval="TSLA", title="Symbol 4")
stock5 = input.symbol(defval="GOOGL", title="Symbol 5")
Price1 = request.security(stock1, "1D", close[1])
Price2 = request.security(stock1, currentTimeFrame, close)
Price3 = request.security(stock2, "1D", close[1])
Price4 = request.security(stock2, currentTimeFrame, close)
Price5 = request.security(stock3, "1D", close[1])
Price6 = request.security(stock3, currentTimeFrame, close)
Price7 = request.security(stock4, "1D", close[1])
Price8 = request.security(stock4, currentTimeFrame, close)
Price9 = request.security(stock5, "1D", close[1])
Price10 = request.security(stock5, currentTimeFrame, close)
PercentChg3 = ((Price2 - Price1)+ (Price4 - Price3)+ (Price6 - Price5)+ (Price8 - Price7)+ (Price10 - Price9))/(Price1+Price3+Price5+Price7+Price9) *100
plot(PercentChg3,style=plot.style_columns,color=PercentChg3>0 ? color.green : color.red )
The way you form thoughts and express in words is not only refreshing, but separates you from all others not only by how you see the market but how you convey it in an extremely articulate way!