Folks -
The session today was contained within both my key levels for the day and did not do much trading above or below it. Not only was the ES contained within the 2 levels today, we also saw the rallies sold in the Spooz, despite a dovish FED per the plan from last night.
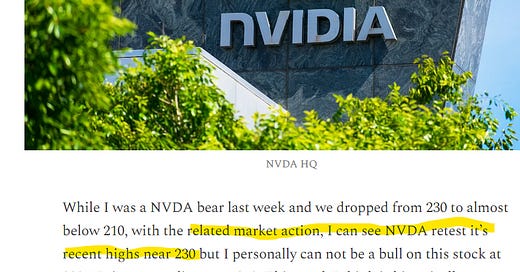
We also saw a good rally in NVDA after it’s earnings which was expected by me from the weekly plan below. I personally can not be a NVDA bull so close to this 230 area. See below Image A.
Today, I also want to share an important code that will convert the ES prices to SPY/SPX prices. Note this is not my script wholly and was shared with me by a very helpful follower (thank you :) )
I have modified the script to update the ratio of ES and SPY in real time for ThinkorSwim (originally the script showed this as delta and not as a ratio). This ratio is real time and dynamic and updates real time when market is open.
To add this to your think or swim platform, click on indicators and select create indicator. Copy and paste this code to the indicator. Finally, add the indicator to your chart. See Figure A below . Figure A shows how this ratio is supposed to look like. So if the ratio of ES to SPY is 10.03, that means the price of Emini S&P500 can be divided by 10.03 to get the price of SPY 0.00%↑ in real time. Let me know if any questions below. Subscribe now to receive more important indicators like this in future .
Copy and paste the below code. I do not own the code, I have just shared this after updating it to show the ratio of ES and SPY.
def symb_es = close("/ES");
def symb_spy = close ("SPY");
def symb_spx = close ("SPX");
def sym_es10 = symb_es;
def sym_spx10 = symb_spx;
def difes = sym_es10/symb_spy;
def difspx = sym_spx10/symb_spy;

AddLabel(1,"/ES : " + (symb_es), color.yellow);
AddLabel(1,"SPX : " + (symb_spx), color.yellow);
AddLabel(1,"SPY : " + symb_spy, color.yellow);
AddLabel(1,"Diff ES-SPY : " + difes  , color.green);
AddLabel(1,"Diff SPX-SPY : " + difspx  , color.green);
If you followed the steps correctly, your ThinkorSwim chart should show a label on the top left side like in Figure A below.
Circling back to the emini, primary expectation was for the market to remain range bound unless we started trading below 3980 or above 4030. This was indeed the case as these levels were the LOD (Low of the Day) and the HOD (High of the day).
If you have not already, read the plan below (new folks).
As if the range was not enough, we saw a clean bounce off the 3985 level in last few minutes, all the way back to 4000.
My key level for tomorrow will be 4003/4005.
It may be hard to sell off hard tomorrow if we do not close the IB below 4005. This is an important level for bears.
Scenario 1: If we remain bid or open above 4005 and do not close the IB below 4005, we could retest some of the highs from today near 4030.
Scenario 2: For a deeper sell off into 3950, we will require an IB close below 4005 I think. At time of this post, we last traded 4000.
Longer term, the bears can be rewarded here if they can keep the pressure on below 4030-4050, which means no D1 closes above it. This is a strong support area going back to many months now. The bears do not want to drop the ball here and they need to fight any advances above 4050.
~ Toc
Disclaimer: This newsletter is not trading or investment advice, but for general informational purposes only. This newsletter represents my personal opinions which I am sharing publicly as my personal blog. Futures, stocks, bonds trading of any kind involves a lot of risk. No guarantee of any profit whatsoever is made. In fact, you may lose everything you have. So be very careful. I guarantee no profit whatsoever, You assume the entire cost and risk of any trading or investing activities you choose to undertake. You are solely responsible for making your own investment decisions. Owners/authors of this newsletter, its representatives, its principals, its moderators and its members, are NOT registered as securities broker-dealers or investment advisors either with the U.S. Securities and Exchange Commission, CFTC or with any other securities/regulatory authority. Consult with a registered investment advisor, broker-dealer, and/or financial advisor. Reading and using this newsletter or any of my publications, you are agreeing to these terms. Any screenshots used here are the courtesy of Ninja Trader, Think or Swim and/or Jigsaw. I am just an end user with no affiliations with them. The data, quotes and information used in this blog is from publicly available sources and could be outdated or outright wrong - I do not guarantee accuracy of this information.


here it is for trading view, but as a chart
// This source code is subject to the terms of the Mozilla Public License 2.0 at https://mozilla.org/MPL/2.0/
// © ChefSoySauce
//@version=5
indicator("Chef's SPY Ratio", precision=4)
currentTimeFrame = input.timeframe("","Timeframe")
use_spx = input(defval=false,title="Use SPX")
symb_es = request.security("ES1!",currentTimeFrame,close)
symb_spy = request.security("SPY",currentTimeFrame,close)
symb_spx = request.security("SPX",currentTimeFrame,close)
dif_es = (symb_es/symb_spy)
dif_sp = (symb_spx/symb_spy)
plot_diff = use_spx ? dif_sp : dif_es
plot(plot_diff)
Tic , any update for the gold , thanks a lot