This is going to be an important post where I dive deeper into the reasons of this sell off and what if anything may stop this sell off in the moment. You do not wanna miss this post.
Let us kick off the post with some price action thoughts..
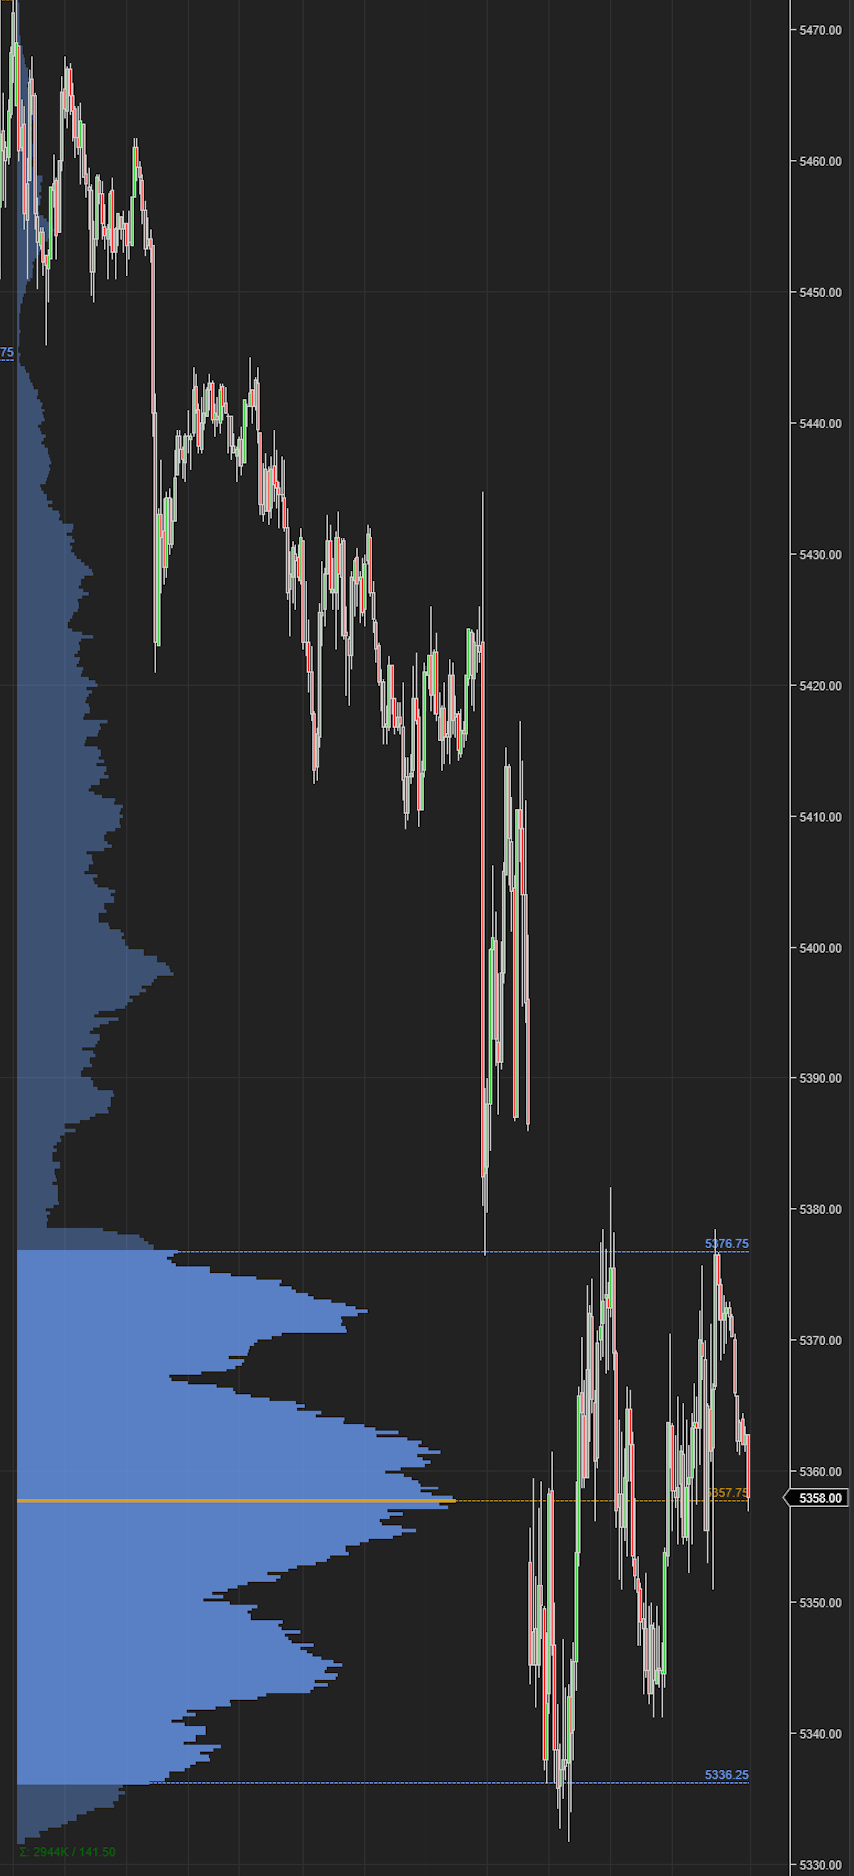
Chart A above is an intraday Emini S&P500 chart showing an overlay of volume profile on it.
You can see significant volume nodes called HVN and gaps called LVN on this chart. If you have NOT yet, I highly recommend you read up on my 3 post work on Volume Profile. Free for all subs.
In this instance you can see if you are selling 5330, you are selling a significant volume HVN. If you gonna buy 5380, you are buying top of the HVN.
These trades can end in frustration as most of the market is not agreeing with you. If it was, then there will not be an HVN. Remember HVN means acceptance. Acceptance of highs. Acceptance of lows. LVN means rejection.
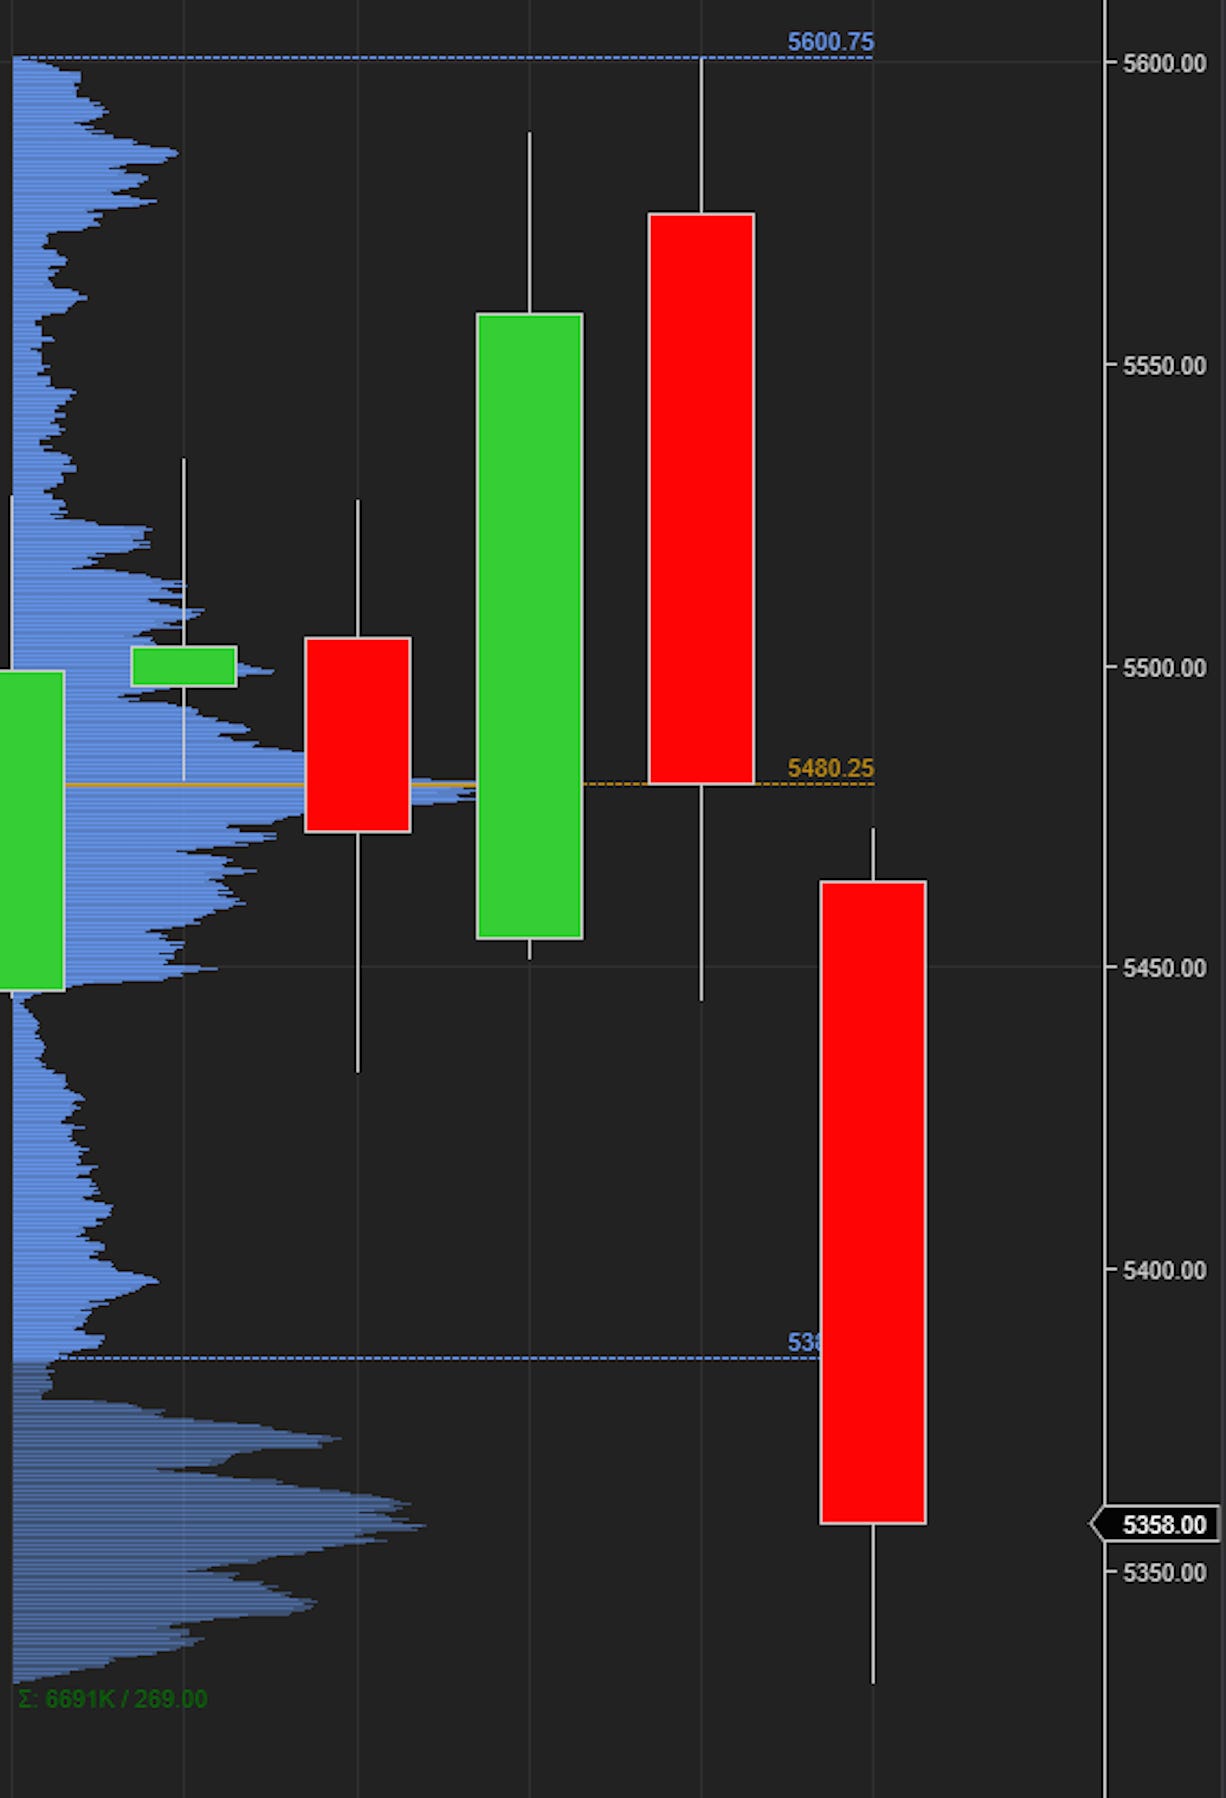
With this out of the way, look at Chart B below. It is the weekly auction.
What we see in Chart B is that most of the volume is within body of last week. Technically this is not as bearish as last week’s auction. This 5422 level is a key level for bears to hold. More on this later.
However, Volume Profiling can give you a great edge in markets and you must get very well versed with it.
Now let us talk about the current thing driving the flows..
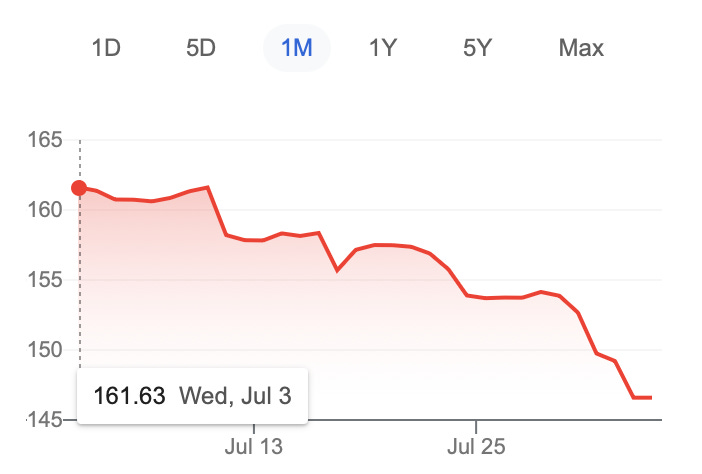
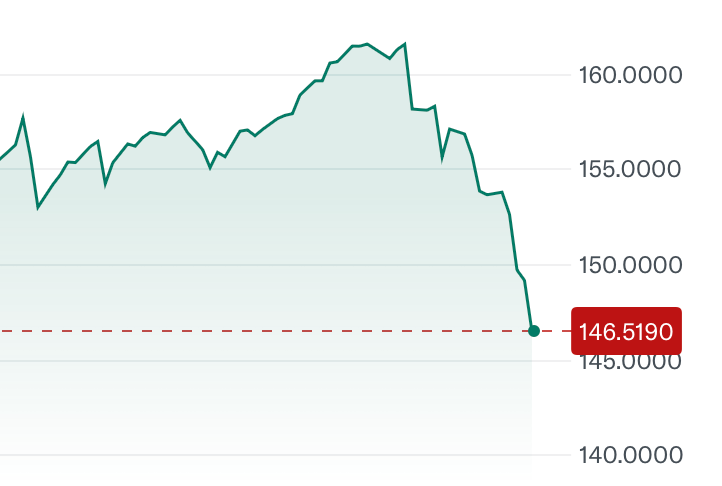
The Yen trade has continued to unwind at time of this post, with Yen having risen about 1600 pips against the dollar in less than a month. This is a monumental move for those who are active in the FX Space and this stampede if you will, has perfectly correlated with the Sell off in the US stock markets which began at SPX index near 5675.
The sell off has caught many by surprise. Only 3 weeks ago, virtually no one believed we could sell off even a 100 dollars from the highs. Yet here we are, routinely trading a 100 points to the downside, almost every other day.
There are various reasons attributed to it-
The US data blindsided a lot of folks coming in much softer than expected. This should not be a surprise however. This has been brewing for some time, and coincided very nicely with a local bottom in the bonds a few months ago. I have been calling this FED’s bluff about no rate cuts and FED is gonna sing like a Canary as soon as we see the first negative NFP print in a few months down the road.
The relatively rapid unwind in the carry trade narrative which may have been triggered by the Bank of Japan’s hawkish statements and surprise hawkish actions, selling billions of dollars into already weakened US dollar.
But one may ask, how can this Foreign Exchange dynamic cause so much havoc in the US stocks?
Well, since the delta or difference between the US yields and Japanese yields grew so large, where there was a significant yield advantage of holding the US dollars over the Japanese Yen, this made a lot of sense in borrowing Yen denominated loans since you pay almost nothing in interest and then using these loans to buy assets like the US Dollar and US tech stocks on margin.
Now normally, Dollar is not the favored destination of such carry trades. Usually it is Selling the Yen and buying the Australian or New Zealand Dollar. Or buying the Mexican Pesos and selling the Japanese Yen as these commodity currencies offer superior yields.
However, with China in a downturn for several years now, it has sort of cooled down the Aussie dollar a bit since China imports a lot from Australia; Chinese slowdown has meant lower demand for the Aussie Dollar. Mexico is having its own political stability issues, causing a dent in the Peso-Yen trade.
This meant all these juicy flows incoming into the US and US markets. Per my estimates, there are about 2 trillion dollars in outstanding loans in Yen which may have found their way into the US risk on assets. Now we are seeing an unwind of those trillion plus dollars.
With the shocking data of last few weeks, suddenly you have folks who want to take profits. This causes large swings or rather large volatility, as seen by VIX. This in turn causes the risk managers at various funds and institutions to adjust their Value At Risk or VAR models. This often means selling down their positions to adjust the position size so the MAX risk fits within certain mathematical models that the firm may have. In a nutshell, professional trading desks every day have a certain band of price movement that they will allow for any position in their portfolio to fluctuate in. Once you start to push beyond this band, the risk management team will require you to trim down the trade size so the position can again fit inside the acceptable band. You can watch the movie called Margin Call on how this may be going down right now at many Wall Street firms. An excellent movie BTW.
So in my view this sell off is a very macro driven sell off with the Yen strength and has less to do with fundamentals locally. Then you have the historical pressure of August and September being weak months, and the few weeks leading to the November election as being even more volatile. So the sum total of this is more pressure on risk on assets, exacerbated by pretty much every one being in the same 5-6 tech stocks.
In times of these volatility, you wanna be networked with folks who have a strong grasp of long term view coupled with short term tactical setups. These volatile times are best for learning and only last a few months out of the year. Do not miss the opportunity and join our community to receive cutting edge levels and research almost every day.
Is this sell off over?
Well, we need to examine the Dollar- Yen charts again and see if they look like they have stopped going down or not?
Let us look at them.
Does USDJPY looks like it stopped doing down?
No.
I mean if I look at the chart of USDYEN, it does not look like to me it is done going down. However, I do think it will have a harder time going down if and when we get to the 130 zip code. It is 146 at the moment. I think as the Yen gets stronger, it will lead to more volatility expansion like in the VIX. At the very least, if you do not have access to good data on USDYEN, I would like to see some VIX readings below 17-18 to signal reprieve from these wild swings.
Now this is not a new stance for our regular readers. We have known for a while the direct correlation between the USDJPY and the SPX. It does not always work like this, however in these last few months, this has been fueling the carry trade and we are seeing this carry trade exodus, more like a stampede.
Now thru July, when the EMini S&P500 was at 5720, and between now at start of August, where it sits at 5350, I have been extremely conservative in sharing any of the big tech high flying names. I have instead shared fewer ideas across the board but mostly on small cap and value names in industrial and healthcare sectors, as well as some in energy. Obviously nothing will escape the volatility spikes like this, but atleast these names have not cratered 20, 30 or even 40% from their recent highs. I am sharing this because, just like last 3 weeks, this is not going to huge change in this week as well. I am going to need to see some signs of life in leading indicators like Tic Top, Delta, VALUG etc to see if it makes sense for the high beta tech names to bottom out here.
There is time to be on the offense, there is time to be defensive and then there are times when you run. It is very important to know what time it is in the markets. Once Tic TOP and some of my other exclusive indicators bottom out, there will be a tremendous number of opportunities carved out. It may just not be today. Please bear with me, no pun.
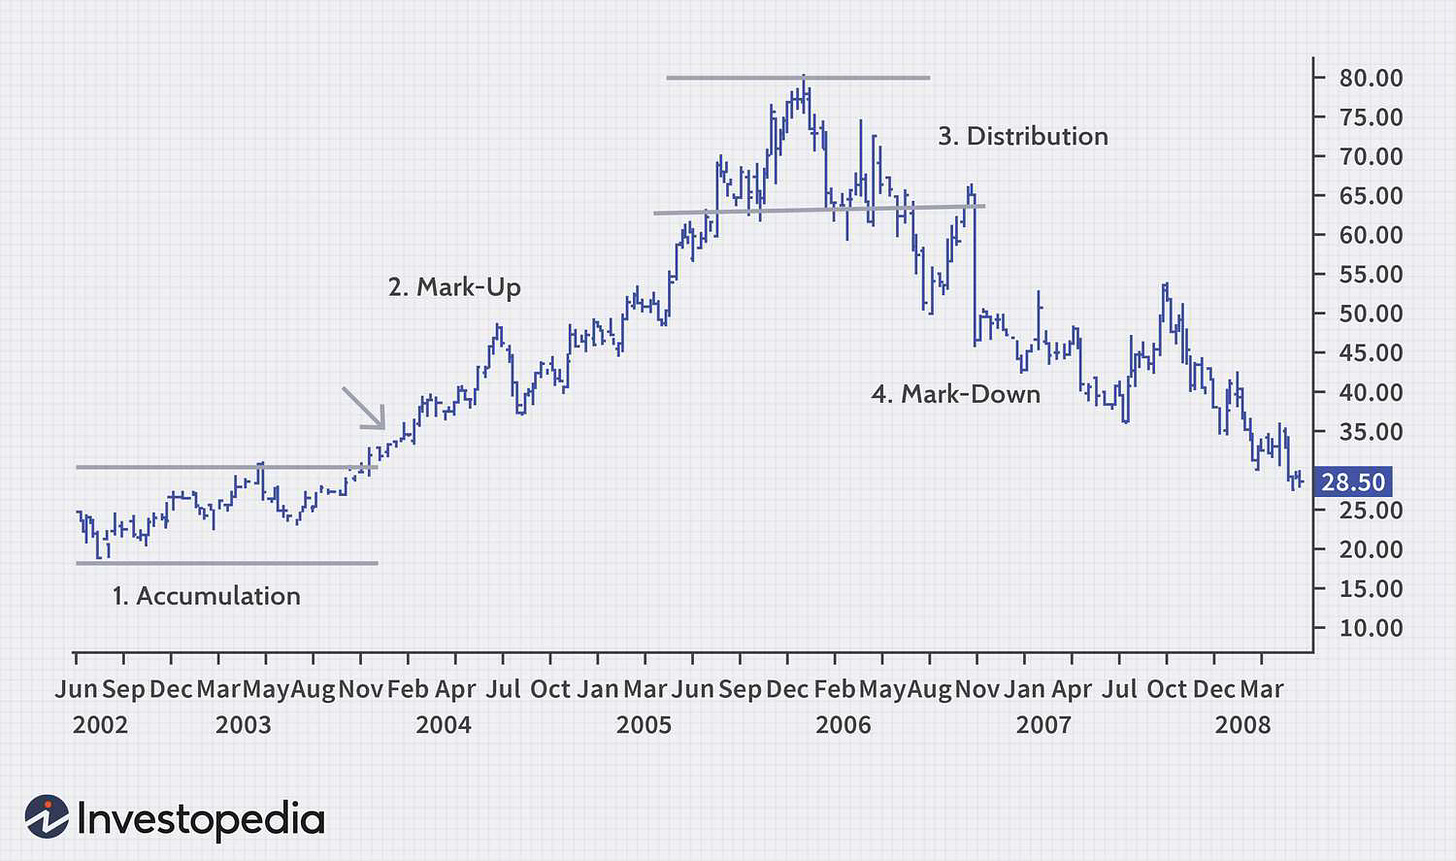
Folks on a philosophical side note, you can see how this episode of volatility underscores the distrust folks have when it comes to these markets and market makers. Let us say some one invested for the very first time into stocks and may be bought SPY at 565 or bought a few shares of NVDA at 125-130. They have been badly burnt and will naturally harbor a mistrust for these markets. However I see this as mostly an educational issue. There are going to be bad players in every industry. Markets do not have a monopoly on corruption. It is every where- however, when you have these market prices based on nothing but speculation and these fads like borrow in Yen and buy NVDA on 2% margins, sooner or later, this is going to come crashing down. It then becomes a Ponzi scheme where the first buyers of such a scheme is rewarded and the last buyer at the top is punished. This is why I always say, it is always better to get in when the accumulation phase is going on. Not when it is in mark up or even distribution. As a rule, the risk in accumulation phase is still there, but it can be managed- 20 to 30% risk MAX is what I am comfortable with. However, once you are in mark up phase, there is no limit to the risk. It could be a 100%!
So when can we see some sell off abatement?
2 weeks ago in my weekly plan I mentioned how I did not like the HVN formation at 5540s that if we failed have back to back daily or weekly closes above 5540, this opens doors to 5250-5350 area. Now furthermore, I think if we trade down to 5250 from these levels here at 5350, this I think opens doors to more volatility in the longer run (year out or so).
At end of the day, we can leave the predicting part to the gamblers and astrologers, we will stick with our battle tested levels to make sense of the market.
These levels come in at 5256, 5330 and 5422-5430 on the week. We are now 5350 on the September Emini S&P500.
In related markets, USDJPY, Dollar are very important. VIX has remained quite elevated but trading using VIX is anyone’s guess as it tends to be finicky and unreliable.
Most of the big tech earnings are out of the way with exception of stalwarts like NVDA. NVDA does not report until end of the month so that takes some pressure off from earnings driven catalysts Some clarity has set in about the rate situation in the US. TLT has made a massive move from that 87 support level and yields TOP I shared a few weeks ago.
So in short, the market now should get into a more watch the Yen action mode. As I said before, Yen may near some sort of local climactic top as it approaches 142-143 area. I see USDYEN harder to trade below 140, before it trades 150-152 again. The reason for this is that I see a risk of inflation in the US picking up steam again, if we were to see a lot of weakness in the US Dollar. I think the markets are assigning a higher probability of inflation picking up with the weakness in US Dollar, if Trump is reelected. US 10 year yields are now sub 4% near 3.75%. This has caused a large drop in longer term rates here in the US, and we saw a larger drop in the mortgage rates down to 6.7% area last week for example.
My longer term view of the 10 year bond situation in the US is that I see 10 year rates below 4% as oversold. I think 1-2 year out, 10 year rate fair value should be around 4%, not 3 or 3.5% even.
From an event risk perspective, you have the 10 year and 30 year auctions next week. These will be extremely important auctions to watch and I will be very curious to see if there is appetite for US debt at sub 3.7% next week. I think there is a lot of long term risk to buy US debt for 10 years at 3.7%. Do you wanna buy US debt, a country with 35 trillion dollar for 10 years at only 3.7%?
Come on now!
With these factors, I see some sort of floor on the US yields here for the 10 year near 3.7%.
If this coincides with a USDJPY near 142-143, I think this presents a compelling reason to see some support come in on SPX and emini near 5200 and 5250 respectively.
Now there is geopolitics going on at the moment which is again anyones’ guess where it leads to. In general, the US wars tend to be bullish as the politicians get another opportunity to increase the money supply and debase the dollar. However, first impulse move is usually down.
With this said, below will be 3 key scenarios on my watch for the week:
Scenario 1: If we are able to break below 5330 by latter part of the week and we are trading near 5250 going into these treasury auctions I want to be bullish at 5250 for a move back into 5330-5350.
Scenario 2: 5330 remains a support until it is broken. If this support holds, I like to see more range bound action here between 5330 to 5384 before next larger move can be determined.
Scenario 3: On the upside, I will fade any moves into 5422 until and unless we begin to see some calm return to VIX below 17-18. It is 22 now.
To summarize: I see attractive short term support as we approach 5250 on the emini, 5200 on the $SPX. On the upside I like to see resistance come in near 5430 with short term ranges between 5330-5380. If you are a bear, you are happy if we begin to find acceptance here below 5422. You are a little grumpy if we begin to close above 5422 again. On the downside, if you are a bull, you are pleased to see a sharp rejection at 5250 and you can’t sleep if we begin to find acceptance at or below 5250.
Let us now look at some other ideas I like
The challenge in this section always is there are weeks when there is nothing exciting going on. Long term readers are ok with it. Short term readers are like where is that next action gonna come from? Well there will be weeks when there is no action. This is a basic attribute of markets. Now look at UNH. I have this when this was 400 with a 600 target.
This target was met now. After 6 months.
Now every one is in on UNH. Which is ok but my point is that it is now 600! It is not 400 anymore!
Same story with war stocks like RTX. We gave it here at 90! It is now 120! In less than a year! I can go on with PM and MO. Given at 90 and 40 respectively. But you get the gist.
Talking of UNH. I like this action if 550 holds. I think if 550 holds, we are headed higher into 700 and if UNH were to do a 6th split soon, I think this will do much better than recent splits in AVGO, NVDA etc which proved to be detrimental.
TSLA
I like TSLA due to the technicals. This is really a technical call on TSLA. It is near 205 now and close to that 200 breakout level recently.
If 200 holds on TSLA, I think this could go back to 230 area.
XAU/GOLD
With Gold, if 2510 holds , I like to see it pullback into 2450s. Just a short term tech idea. It is about 2490 at the moment.
On the miners like NEM, if 51 holds, I like to see 44-45 retested first. It is around 49 now.
MOPEX PUT of $46 for 8/16 is 35 cents at the moment, and I like it as a lotto play.
GEO
GEO is an old orderflow stock I shared at 6 bucks before it almost tripled and traded above 16.
With recent sell off , the stock has softened and is now trading 13 dollars and change.
I like 12 support on GEO and if this holds, I see this trade higher into 16-17 again. If 12 holds on GEO, I think this sell off is unfair and we can see older highs retested on GEO.
AAPL
I will like to see any weakness into AAPL supported for a push higher into 230. It is now 220.
I think if it were to sell down towards 210, this becomes an attractive support and could see the stock supported for a move back to 220-226. AI has not yet delivered tangible results for many of the companies that have poured billions into infra, chips and what not, but I think AAPL has a shot at monetizing some of this fluff. I do not think all AI is hype and I think AAPL may be able to harness its vast user base to monetary benefit from the AI and its capabilities. This is why I also think unless AAPL were to start trading below 208-210, a longer term bear market may elude us. So it has to be taken out for some serious selling to show up on the tape. AAPL’s gains are GOOG’s losses though.
~ toc
Disclaimer: This newsletter is not trading or investment advice but for general informational purposes only. This newsletter represents my personal opinions which I am sharing publicly as my personal blog. Futures, stocks, and bonds trading of any kind involves a lot of risk. No guarantee of any profit whatsoever is made. In fact, you may lose everything you have. So be very careful. I guarantee no profit whatsoever, You assume the entire cost and risk of any trading or investing activities you choose to undertake. You are solely responsible for making your own investment decisions. Owners/authors of this newsletter, its representatives, its principals, its moderators, and its members, are NOT registered as securities broker-dealers or investment advisors either with the U.S. Securities and Exchange Commission, CFTC, or with any other securities/regulatory authority. Consult with a registered investment advisor, broker-dealer, and/or financial advisor. By reading and using this newsletter or any of my publications, you are agreeing to these terms. Any screenshots used here are courtesy of Ninja Trader, FinViz, Think or Swim, and/or Jigsaw. I am just an end user with no affiliations with them. Information and quotes shared in this blog can be 100% wrong. Markets are risky and can go to 0 at any time. Furthermore, you will not share or copy any content in this blog as it is the authors’ IP. By reading this blog, you accept these terms of conditions and acknowledge I am sharing this blog as my personal trading journal, nothing more.


