After a week that this was, may be I should take a whole week off ;)! I had some very amazing calls in NVDA (from 550 to 600), SMCI (from 240 to almost 450), SAVE (from 8 to 5 and then from 5 to 7), AVGO (from 1050 to 1200), AMD, GOOG, AMZN (150 to 155) to name just a very few.
Always looking forward to share anything interesting that crosses my radar with folks here.
And the first that crossed my mind was the question is there a way we can avoid conformity or it is built into the matrix?
This week was a good example. I spoke with a number of folks over last week or two, and my take away was that they were bearish at start of the week at the lows, which can be fully justified, based on the price action and economic data to start the week off. However, as the week progressed and it became amply clear that 4750 was going to be sticky, I felt there was a need to reassess our bearish bias for rest of the week.
The Golden rule for me personally is to look to your left and then look to your right- are all three of you bearish or strongly bullish? If so, that is not a good contrarian signal.
A lot of traders are in atleast 2 or more market related channels or follow the so called experts (aka furus). Many of us could even be following 5 such furus or more. The general rule of the thumb for me is that when most of the so called experts agree on something, then it is time to fade that something. Many of the furus are part of the zeitgeist- which is to say they think and perceive things similar to each other. For original insights, you must follow more guys that think least like you. Hallmark of conforming cultures is the formation of large groups which think and act alike with no room for dissent.
Is trading hard or easy? Are you a bad trader?
A lot of folks have been doing this for a long time. I assume most of my readers have been active traders for 2 years or more.
I am going to make a statement below and I will challenge you to prove it otherwise.
Trading, when it is seen in context of % of winners and losers is easy. It is not hard.
If this was not so, most of you will not be doing this. Winning creates dopamine and that brings happiness. Nothing releases more dopamine than random winning.
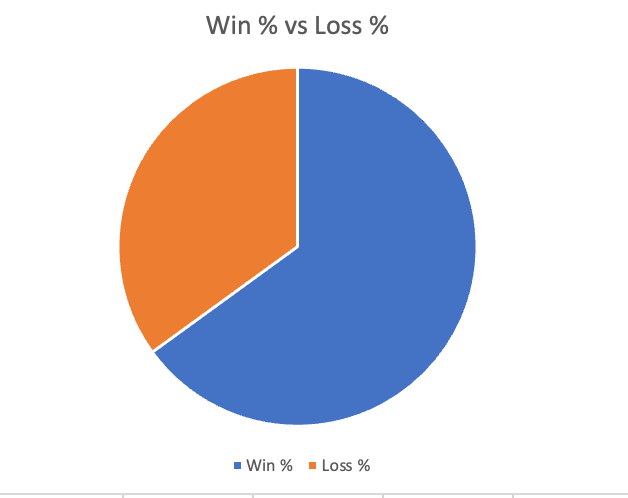
In fact, I challenge the reader to go back and do a backtest of their trading results. A very large percentage of you will come back with atleast a 60-65% winning ratio of trades. See Figure A as a sample of how most of traders’s win to loss % will look like. I am talking about hundreds of thousands upon thousands of traders. Not just a handful.
If the Percentage of winners is so high, then why is trading so hard?
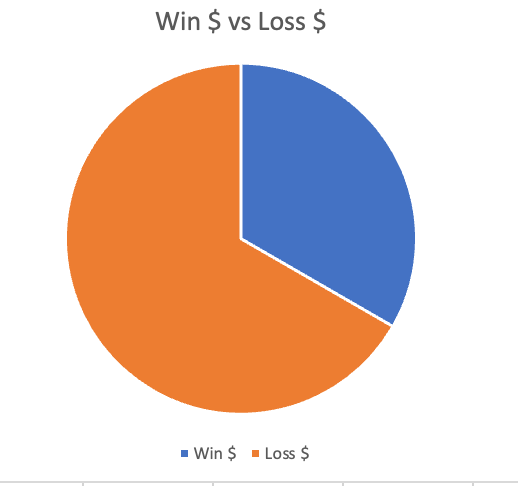
The answer lies in Figure B below.
Some of you may even have a win rate of even 75% or more. However, most of us, when we look at the size of the winner, it is puny, compare to the size of the loser when looked at from a perspective of 1000s of trades.
So, even though trading seems easy when looked at from Figure A above, it is actually EXTREMELY hard when you realize what is going on from Figure B.
TO become consistently profitable we have to reverse this paradigm. We have to come up with a methodology which may only be 35-50% right, but when it is right, on average it nets a 1000 dollars and when it is wrong then it losses 500 dollars on average, to just name an example.
Once you truly understand the significance of this, two things happen. A) You can finally stop chasing the futile and impossible search of the “Holy Grail”. In my 20+ year brief experience, I do not think it is possible to come up with trading system that is more right than 60-65% of the times, unless you are talking about front running a large order (you are an HFT algorithm, which you are not) or you have insider information (which I hope you do not have ;)) .
B) You can actually now focus on finding levels and set up that can potentially net 20 pips or points risking no more than 10 points or so. Again, an example, but you get the idea.
This shift from a trader that focuses on maximizing win rate to a trader to a trader that focusses on minimizing loss size will be a profound shift in any trader’s career. It is the most important thing, and yet ironically only a very few of us I believe can ever get there as it is psychologically wired in us to be “right all the time”, “avoid loss at all cost”, rather than “focus on winners and cut the losers”.
Now psychologically this can be a huge deal if you have been in this pattern for several years. This is the trader who is consistently winning now for many years on most days, but then loses it all on a one big bad trade or one bad day. In such cases, it may even be easier to not focus on increasing the average wining size but actually control how much one can lose on a given day. So as an example, if one makes 1000 on an average day and the bad day loss is 5 grand, then it may just be better to stop trading altogether when the daily loss exceeds 1000 or more.
Just my humble 2 cents: supported by math.
Like my last weekly post was geared for the investing time frames where the investors buy and hold Bitcoin for a final push into 1.5 million, this post is more for intraday time frames not necessarily investing time frames but the general idea still applies.
Now a quick recap of the week that was for my ideas
To start off the week, I had a bullish bias on the general market. My primary reasoning for a few weeks has been that the chip stocks are leading the charge and it has in turn created strong momentum in Nasdaq which has been pulling rest of the market higher. This week was no different.
My main premise was that any dips into 4760-4770 area could be bought for a retest of 4850. And bought they were!
Such was the ferociousness of the rally that after these levels were tested early on in the week, we marched some 100 points higher within two and a half sessions!
These holiday shortened weeks usually tend to be quite bullish, so something to keep in mind.
Folks, I also received a few questions about one of my technical system shared earlier in the week, asking about the significance of this 50 day average. There is no more significance beyond the fact that most of the investing professionals use a 50 and a 200 day moving average which becomes a self fulfilling prophecy on its own.
Most market participants that I know use a simple momentum system. The tools can vary but the underlying thought remains the same. They buy short term pullbacks when the long term trend is up and they sell retracements when the long term trend is down. Simple trend following.
50 day and 200 day averages just so happen to be good tools to measure short term pullbacks and long term trends. You could really chose any variation of this. It could be 5 Day MA versus a 20 DAY MA or a 20 MA versus a 50 MA. The time frames do not matter, although I will say this is more accurate and relevant for higher time frames.
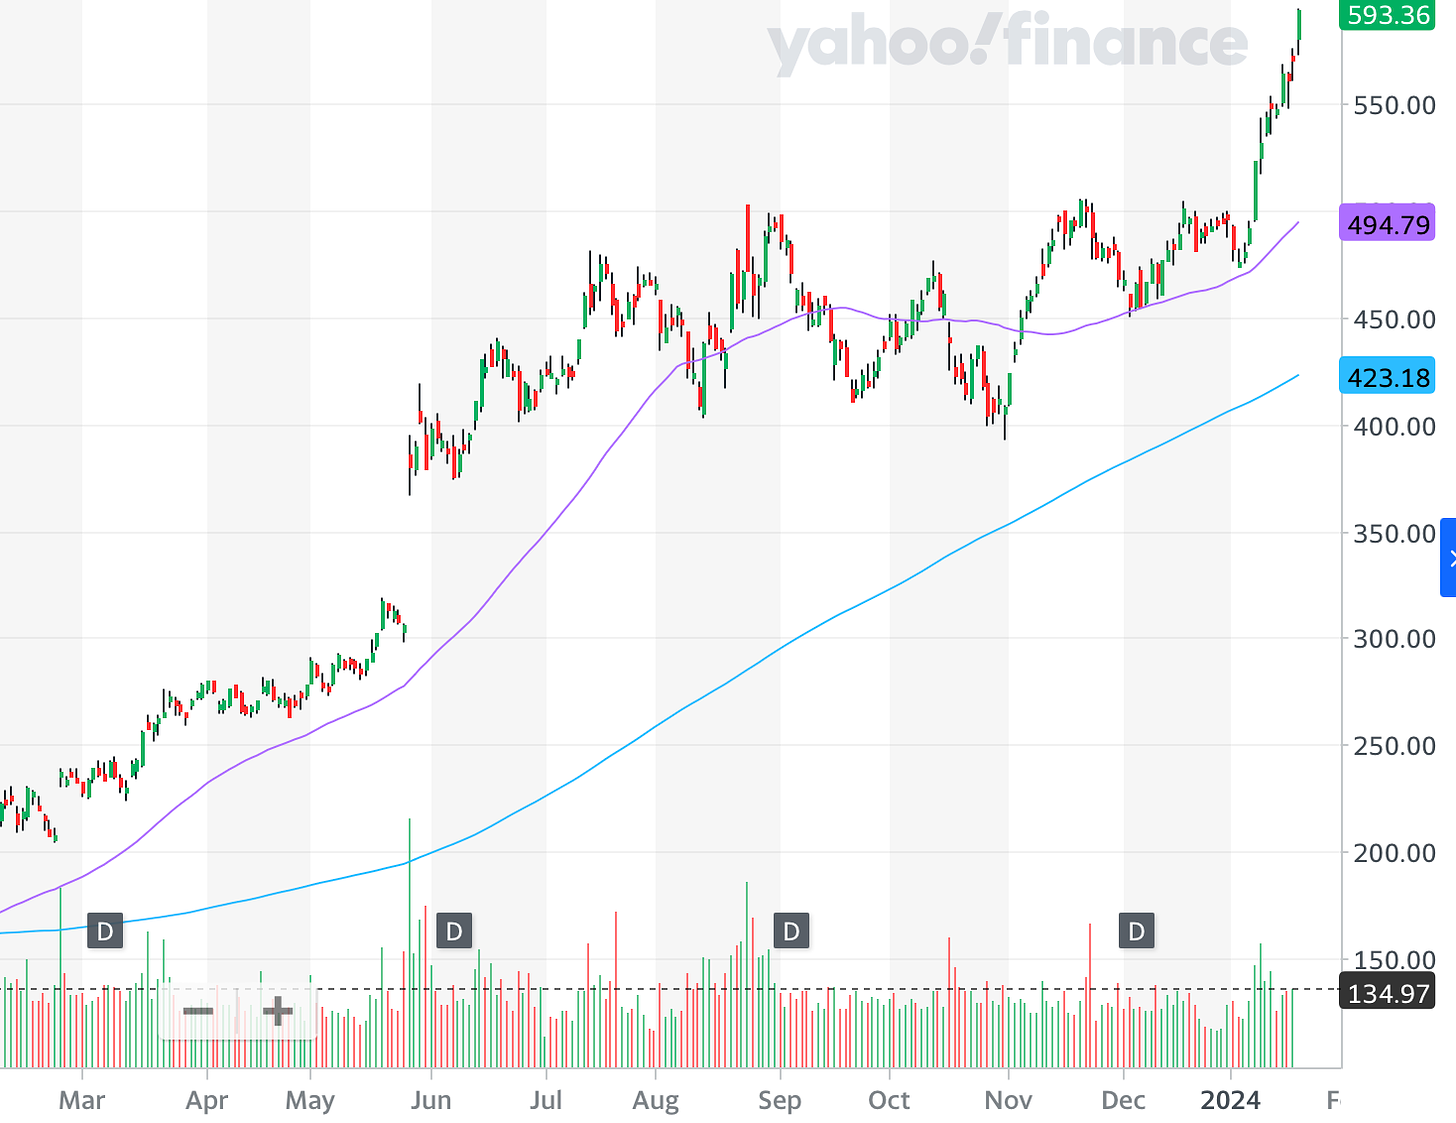
Here is an example below.
Chart A above shows NVDA 50 DAY MA (in Purple) constantly trending above its 200 DAY MA (in Blue).
MA standards for a simply moving average if any one is curious.
As you can see, the pullbacks in such a situation are shallow and are quickly bought up. This type of action is fairly common in strongly trending markets like NVDA as we are seeing at the moment and can work both ways. Up or down.
You can further qualify such a system with volume. In general for strong trending markets, the volume on upthrusts should be higher than volume coming in on pullbacks. This is very indicative of bull markets. Towards end of such bull markets, one of the first signs of trouble in paradise could be upthrusts with smaller than normal volume, or extremely high volume with no accompanying price change or a small price change.
This indicates that while newer bulls are happily buying at the highs, the older bulls are selling into this excitement. If this was not the case, the price will move higher on strong volume, not stay unchanged.
Volume is extremely important in any market. It is the only indication we have as retail of activity. Activity indicates interest. This is important.
Other variations of this system can be a new 50 day high when the 50 day moving average is above 200 day moving average and that alone is a potent trend trading system on its own right.
My levels for this week
In this section, I want to share my levels in the emini S&P500 Index where I think potential support and resistance may come this week.
When we say will the S&P500 make a new high next week or not, we are essentially asking if NVDA will make a new high next week or not? This is a market of AI Chips stocks in this moment.
In other words, if you ask me if I am an S&P500 bull or bear next week, I will ask you where is NVDA headed next Friday, to 620 or 570? Such an outsized impact these AI tech stocks are having on the general market now.
From a technical view, this market is in price discovery mode at the moment.
However, there are a few important clues. Whether that is an SMCI call at 420 or NVDA PUT at 570.
Remember both 450 and 600 were my recent targets on SMCI and NVDA, when they were trading at 240 and 400 respectively which I shared in this Sub stack in recent weeks and months.
If you are interested in support levels like the 4750 from this week or intraday chats where I shared 4820 as support on Friday, then consider subscribing to the newsletter.
Since, these targets have now been met, or are in a 2-3 % vicinity of being met, I am going to say these could potentially be key levels this week which could decide fate of the general market on the week.
My key levels in these 2 will be 600 and 430 respectively. I think as long as these 2 hold, they may potentially cap rallies on the main index as well which is now trading around 4870.
420 SMCI weekly Call is right now around 22 dollars. IF SMCI goes to 430 and this call becomes bid 24-25, I think it becomes very expensive and sensitive to a move down towards 400 dollars.
Then on the NVDA side, I find the 470 weekly 1/26 put interesting which is $2.73 at the moment. I think come Monday, Tuesday if this PUT trades near $2, sub 2 it becomes quite interesting. Note these are short term weekly levels, I am not reading too much longer term into these OPEX flows.
This brings me to my key levels on the Emini S&P500 index. This week, with the PCE index, and the next week, with the FOMC, are going to be pivotal weeks in my opinion which could decide if we begin a new bull market now or we collapse back into 4500s. You may not want to miss this.


