Traders-
In this chapter, I will talk about the Depth of Market (DOM) or Order Book which is also commonly known as Level 2. I will also show some examples how I use LEVEL 2 in my own trading. This will be my introduction to what I regularly call “Tape Reading” and where to read it. If you enjoy this post, make sure you like and share it as it helps me grow this channel reaching more traders.
Note: if this newsletter does not come fully through your email that means your email provider has truncated this email due to being too large (Gmail cuts it off at 102KB!) . Just click on the link at the very bottom, view the post in browser to see in its full glory with all screenshots and images.
This newsletter assumes the reader has basic understanding of the terminology and knows the primary elements of volume profiling (VWAP, VPOC, VAL, VAH etc).
However if you are totally new to this, fear not, but start by reviewing the links below:
It also makes sense to know before hand who it makes most sense to use Level 2 before we go any further.
While the concepts and the methods documented here are potentially applicable to any market in any time frame, the day to day execution using a DOM or a Level 2 like this in my opinion is for an active trader who is at his or her desk, watching the market in real time and executing trades with relatively high frequency. Personally I am at my desk 6 hours a day every day and find the DOM indispensable. For any one making swing trades or one or two trades a day, a DOM while helpful, is not necessary. You can glean the same information from the charts and regular volume/market profiles. Many of these tools cost a up to 2 grand plus a monthly subscription. So it is a big investment at end of the day.
Depth of Market or Tape or Order Book as it is more commonly known is a list of pending orders for an instrument like SPY. It is a list of Buy and Sell orders for an instrument and changes throughout the day/session as buyers and sellers enter, exit the market. The basic purpose of the order book is to match sellers and buyers. Every trade you make, whether that 100 shares sold on Robinhood or that one SPY call on ThinkorSwim, all goes to an Order Book to be executed. Very few instruments like Over the Counter (OTC) Forex or Penny Stocks may stay in-house with your broker and never leave for an orderbook as your broker takes positions against you.
Order Book can be thick or thin. Typically, thick order-books have large tick sizes (30 year treasury futures are extremely thick markets and have a tick size of $31.625). Thinner order books are easier to move around and have smaller tick sizes , for example Nasdaq futures have a tick size of 5 dollars.
All US stocks priced more than a dollar have been decimalized. Meaning the minimum tick size in these stocks is $0.01
Order Books can be decentralized or centralized. Most CME and CBOE instruments have a centralized order book, also called CLOB (Central Limit Order Book)
Order Books support several types of orders. There can be dozens of order types, with Limit Orders and Market Orders being the most common. In this post, as this is a basic 101 post, I will not cover all order types. I am also not going to talk about the matching algorithms at this point so as to not bore you. That will come in the subsequent installments to this post.
Chart traders swear by charts and trendlines. I respect that. I just humbly believe an order flow based approach can reveal a lot more about the market being traded than just charts alone.
What values does DOM add?
When I trade using charts alone, I may see that S&P500 Emini last traded 4800. At best I may see S&P500 has a bid at 4801 and offer at 4800. What I do not see is what is being traded at those prints- and many times What may translate to Who.
What size is trading at the offer and bid may tell me the market is being controlled right now by small traders, by the market makers scalping it out, or large traders like hedge funds establishing new positions or getting out of old positions.
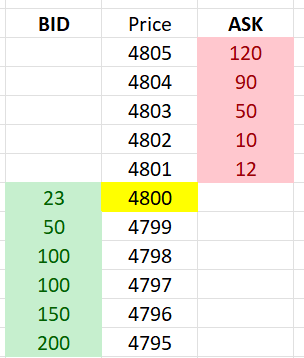
Consider the following image. 4800 highlighted in Yellow is the last traded price. This is in my opinion a very one dimensional view of the market when you trade using charts- you see the price. Which is still better than using indicators - but I digress, that is another day’s topic.
What if I told you there is another way of looking at the market. See below. Other than just looking intimidating with more numbers added to the Price attribute, does it make any sense?
Let us go through these 2 new attributes:
BID: Think of these as the buy orders. These are the guys waiting in line to buy. There are many reasons they are waiting in line, it could be that they are scared to buy Emini outright at the current best offer which is 4801, they may be patient buyers with information that market will trade lower, wanting to buy at the lower prices or they may just be splitting a very large order to accumulate a large positions. The reasons why they are waiting does not matter- what matters is they are passive traders and what market does to their passive orders is far more important
ASK: Just like the passive, patient buyers, these guys are passive sellers. They are just waiting in line for the market to come to them and buy from them.
We have now introduced another dimension or attribute to our 1 dimensional price only view of the market. This is now a 2 dimensional view of the market. Not only can we now see the price, but we can also see the buyers and sellers at different prices, both above and below the last traded price.
Now keep in mind, the numbers on BID and ASK do not mean the number of buyers or sellers as some one very new to this may assume. It just means number of lots or contracts or shares- dependent on type of market traded. This is a big difference.
So it is natural now to ask that since we can see number of buy and sell orders on the price axis, trading must be now a walk in the park or stealing candy from a kid..
Not so soon…
In 2022’s market, simply being able to see the number of buyers or sellers at different prices is not enough. It actually has not been enough ever since the High Frequency Trading algos really took off post 2010/2011.
Before that you could make a reasonable guess of demand or supply pressure by casually eyeing the number of orders on price axis. Not any more.
Why it that?
This question will probably need 2-3 blogs on its own to answer and we may still not answer it quite right but suffice to say with technology, it is easier to enter, execute, cancel orders. The exchanges themselves encourage this behavior as more trading leads to more commissions and therefore more revenue for the exchanges.
So while in theory, a newbie will be forgiven to assume large number of orders at BID is indicative of support or demand, and a large number of orders on ASK is indicative of supply or resistance, in reality, the picture is quite different.
Two major concepts make this assumption invalid. The first is spoofing. A spoofer while illegal in many jurisdictions, still have become quite sophisticated to evade detection, yet they operate at all times in most liquid of markets.
Spoofer’s wet dream is create fake orders and make the market believe they are real.
When market sees these sophisticated, but fake orders it naturally goes away from these large orders because who wants to sell in front of a 2000 BID, right guys? As market moves away from this BID on an uptick, the spoofers sells into this uptick, and then turns around and cancels his fake bids. Market falls back to where it was before his shenanigans and he gets out often for a tick or two. He does that all day long and a couple ticks here and there, add up on 50-100 lot orders.
Second main phenomenon that makes this 2 Dimensional view of the market treacherous is a variety of hidden orders. Colloquially knowns as iceberg orders, their main purpose as the name implies is to hide the true extent of the order. In finance markets, not every one is an altruist like Elon Musk who gently tweeted his intention to sell to his 50 million followers before proceeding to sell 10 billion dollars in TSLA stock. Perhaps he wanted TSLA market to go down so he could load up on calls at 1000, who knows, but for most traders who try to trade large size, they intentionally want to hide their buying or selling.
So, many exchanges allow for these sophisticated orders where I can split to trade a 10000 lot order in smaller chunks, sometimes as little as 1 lot. I can schedule them to sell along the price ladder or DOM. I can schedule them to sell at certain intervals.
So spoofing and icebergs make our little 2 dimensional view of the market fun to watch but not very actionable (or profitable).
This is where a 3rd dimension of the market comes into picture. I call it the tape or in other words it can be called Time and Sales.
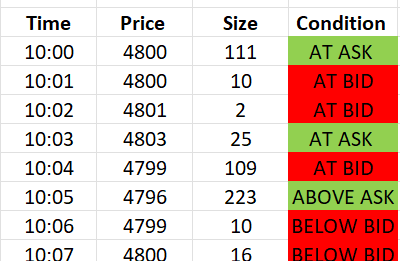
Time and Sales is simply as the name implies, the time and condition of the trade. So it tells me at what time, what price did we sell or buy and what size? More sophisticated platforms or tools also tell me if the trade was at offer, at bid, above ask or below best bid. This is GOLDEN information if you ask me.
This is also only possible due to technology. Some 20-25 years ago only the biggest traders could get this info. You had to pay 1000’s of dollars in data fees to get this info. Public like you (and I) often got this delayed by as much as half an hour from the exchanges. Exchanges guarded this like holy grail. Why? Give it a thought.

Lucky for us we can now get this Time and Sales data on our computers, paying as little as 15-20 bucks a month for a Level 2 data package.
A typical Time and Sales window may look like this (Figure A). You can see Time of trade, size and price of trade and if that trade was at ask, or at bid.
Remember in trading, every sell is a buy also for someone. And every BUY is a sale for another. Like when you buy a TSLA you have have bought it from some one who has sold a TSLA (unless he is an evil short seller and should be squeezed).
This is not true in futures necessarily where the contracts are created from thin air once a BID and ASK cross. In general most of these time and sales are showing the actions of aggressive traders (marketable orders) not passive ones (limit orders).
Ok so we now understand what is a time and sales (hopefully). How to put this tie this together..
Using Time and Sales and our 2 Dimensional market from the prior section, we can marry them off and create a 3 Dimensional view of the market that starts making some sense to us assuming you have watched it long enough.
But before we go there we need to understand the role of an Aggressive trader.
Like we had talked about passive traders who sit with their little orders on ASK and BIDS, if it was up to them, the market will not move an inch. Up or down.
There is only one reason and one reason only why ANY market ever moves and that is because of the aggressive traders who hit the passive limit orders with their marketable orders.
While a limit order says I am gonna be filled only at a certain time and a certain price, the market order says I do not care what price I get filled, I need a fill!
Think limit orders think passive. Think market orders think aggressive.
So then tape is created by marriage of limit and market orders. Their consummation and intercourse creates all price movements.
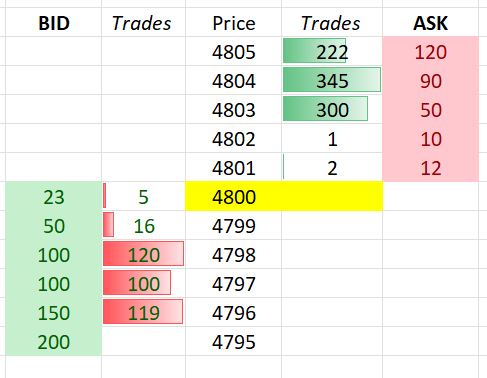
From a tools perspective, while you can analyze and trade using any time and sales and DOM, for sake of this exercise I am going to use the following example (Figure B). This same information is shown by most good trading DOMS . These are not free tools however and can run into 1000’s of dollars to buy and 100s to subscribe. If you use Sierra chart or some other similar platforms, these can be created for free . Tweet at me and I should be able to point you to some resources.
In the following graphic (Figure B), I introduce a 3rd attribute or dimension to the mix of Price and Orders, called Trades. Trades , unlike the passive orders sitting on BIDS and ASKS are REAL Trades hitting those orders by the actions of aggressive traders .
Many guys asked me what I mean by Tape when I say tape and how they can also watch it. Well this is tape for me. Watching it is tape reading for me. I watch this screen for 6+ hours every day. I have watched this for several years now, every single day!
So on the right hand side of the Price Column, while the ASK holds the orders for sale, the GREEN histogram represents the Buying that has happened at those prices .
On left side of the price , the BIDS are orders resting currently for BUYING, however the RED histogram represents recent sales at that price.
Often times or almost at all times, the numbers in BID and ASK are fake and cannot be always trusted.
The numbers however on the Trades column are always 100% legit. They are real trading that has happened at those prices.
Once you have watched this screen enough times, you begin to develop a feel for what the interaction between PRICE, BID/ASK and TRADES Columns means.
Now while good quality DOMS show this information in one screen, you can still use traditional LEVEL 2 and Time and Sales window to get to the same information.
In this post I will not be discussing real life scenarios, however if you think this made sense to you, make sure you subscribe and share my Substack to get a copy of the follow up post on this as soon as it is published!
The above figure IMO holds as much information as one can about any market in any given point of time. This is as real as it gets for us humans - unless you are a quantum physics algo and can see through vast distances or have an XRAY vision into the plumbing of market at a nano second scale, this is as good as it is ever gonna get for you and I.
Obviously in real life , the tape moves. And it moves very fast. However all movements of tape, the madness, always has a method behind it. Given enough time watching it, you begin to develop a sense of this method behind this madness.
Who exactly is this type of trading or analysis for?
Well lemme first tell you who this is not for. Any one who is an investor and holds for months to years, I do not see how this information may add value to what they do.
Everyone else whether a scalper, or a day trader or even a swing trader can get some value out of watching the tape.
In general, in my personal opinion, it takes about 2 years of watching the tape to make any sense of it. Watch it for a minimum 1-2 hours in a very active market is a must. Which for many who work 9-5 is either not possible or it may mean they wake up at 2 and watch it during London or Tokyo sessions. When I was learning I will often watch a market like Nikkei in night or watch the German bonds or DAX etc in the wee hours of morning like at 2 am!
A lot of this is subjective. There are few if any rules other than accumulation, distribution etc. It is like any language. To master it you must master the nuances.
Do not rush out yet to buy an expensive DOM tool which you may never use later. I recommend that you watch just the old school Time and Sale for a couple weeks and see if you like what you watch. This is a very different way of looking at the market- which focusses more on your analytical and mathematical abilities - and understand this is not for every one!
While this is just a very basic introduction to the tape, my upcoming posts will have many more similar posts with actual examples and screenshots from the real tool to aid with learning.
What kind of set up I can trade with this methodology:
While this post was not intended for any set ups, I will cover a basic trade I do all the time, the follow up Blog to this post will contain my most common 5-6 set ups that I trade almost on a daily basis with tape reading.
If you look at this screenshot, just a casual glance will tell me the buyers are a bit dominant at the moment.
Why? Stronger or larger orders at BID compared to ASK means there is heavier demand. Then the Trades in GREEN are heavier than trades in RED. Again denoting to me the BUYERS are in control at this moment in time (not to say that cant change next minute).
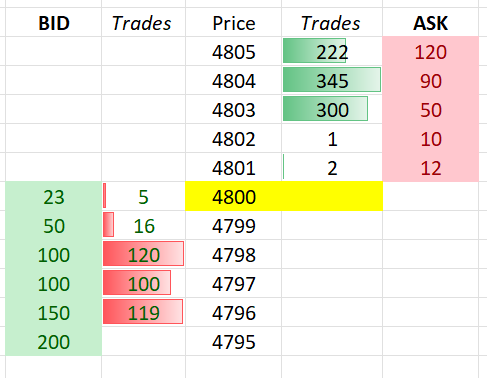
So let us say given this context I buy at 4800 (Yellow Highlighted Price). Regardless of I am right or wrong, I will tell you what I do not wanna see a few moments after I go long at 4800. See below screenshot.
The moment I go long at 4800, the tables have flipped. I see far less trades in GREEN now and the TRADES on BID (RED) have picked up steam. To make things worse, even the AT ASK orders now have firmed up and the AT BID orders start shrinking. Buyers run away!
This means I should either double down and try to get out at break even or take my loss at 4696 and wait for another opportunity or go flat and then go short right away. However staying long given this change in order flow is not the recommended play for me.
As you can see this is very dynamic style of trading. You can only imagine what information this kind of tape reading must be conveying at key support and resistance levels once you become comfortable reading it.
This is it from me for now. Did not want to make it super crazy as I wanted folks to be introduced to the tape reading 101 first. Much more on tape reading in near future!
Stay tuned and do not forget to subscribe to automatically receive the email the moment my future posts are published.
Following are some other good readings if you want to learn about my style of trading a little bit more.
I added below new posts to this digest:
I think it is most important what happens after we have that first loss of the day. I added some pointers on how to deal with it in the post below:
Few new posts on technique and charts how I stalk potential setups:
Nailing the TOP: 4717
Nailing the Bottom: 4611
My main trading style is Price action and orderflow with very little to no charts and I wanted to create a micro site with these concepts for others who have similar style or starting out. I started documenting the foundational stuff which will mature and get more complex to the microstructure/DOM level as we go along.
Usually I publish 2-3 posts every month (time permitting) and these are the important ones which are recommended reading for Order flow understanding:
Terms, Definitions, Basic Concepts
How I measure and Trade Momentum
The goal is to progressively increase the complexity and end the year with DOM, Delta, Microstructure level concepts. But first the foundational stuff :)
Feel free to share with like minded order flow and price action traders.
~ Tic
Disclaimer: This newsletter is not trading or investment advice, but for general informational purposes only. This newsletter represents my personal opinions which I am sharing publicly as my personal blog. Futures, stocks, bonds trading of any kind involves a lot of risk. No guarantee of any profit whatsoever is made. In fact, you may lose everything you have. So be very careful. I guarantee no profit whatsoever, You assume the entire cost and risk of any trading or investing activities you choose to undertake. You are solely responsible for making your own investment decisions. Owners/authors of this newsletter, its representatives, its principals, its moderators and its members, are NOT registered as securities broker-dealers or investment advisors either with the U.S. Securities and Exchange Commission, CFTC or with any other securities/regulatory authority. Consult with a registered investment advisor, broker-dealer, and/or financial advisor. Reading and using this newsletter or any of my publications, you are agreeing to these terms.


Mr. Tic, today’s DOM & all posts are 24carat GOLD & will keep learning from it, Thank you.
Hi Tic, thanks for this great post, I have a question wrt point 5 of the last part "and the TRADES on BID (RED) have picked up steam" - can you explain please? It's not clear to me looking at the last 2 order table screenshots (looks like number of trades on bid size has decreased).
Btw how can the number of trades at 4796 go from 119 to 1 ? this is calculated over a different time frame ? thanks!